 News
News  Coin Information
  About us
  Customer Service


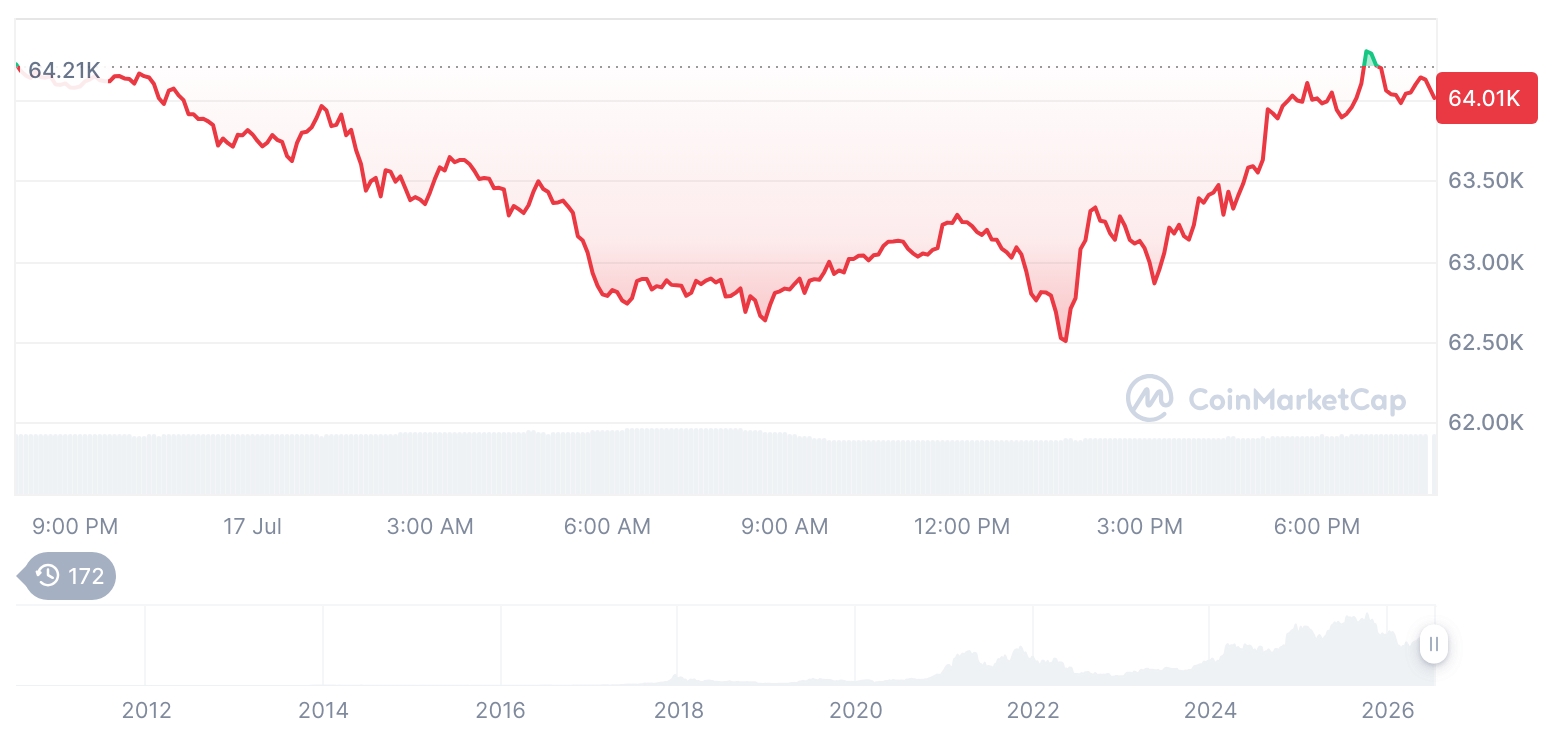
Bitcoin (BTC) retreated to around $59,800 on Thursday, with market sentiment stuck in 'extreme fear' as fresh inflows into centralized exchanges pointed to the risk of renewed short-term volatility.
As of 2:34 a.m. ET on June 26, Bitcoin was trading near $59,859, down 2.70% over the prior day. Despite the decline, spot trading activity picked up, with 24-hour volume rising 2.12% to about $43.97 billion—an indication that dip-buying and risk reduction trade flows are both active rather than liquidity simply thinning out.
The latest five-session performance underscored a market struggling to stabilize after a sharp pullback. BTC posted gains of 1.15% on June 22, followed by three consecutive daily declines (-2.02%, -2.59%, and -2.08%) before a modest rebound of 0.30% on June 26. The pattern suggests sellers have been in control, while the latest uptick looks more like a pause than a decisive trend reversal.
Traditional markets were largely steady by comparison. The S&P 500 slipped 0.01% to 7,357.49, while gold fell 0.42% to $4,031, offering little evidence that the day’s crypto weakness was driven by a broader macro shock. Instead, crypto-specific positioning and sentiment appeared to be the dominant forces.
Trend indicators continued to reflect a bearish bias. Bitcoin’s daily MACD stood at -2,298.12, and the weekly MACD at -5,850.10, with both readings remaining in negative territory—typically consistent with a market where rallies face heavy overhead supply and traders remain cautious about chasing upside.
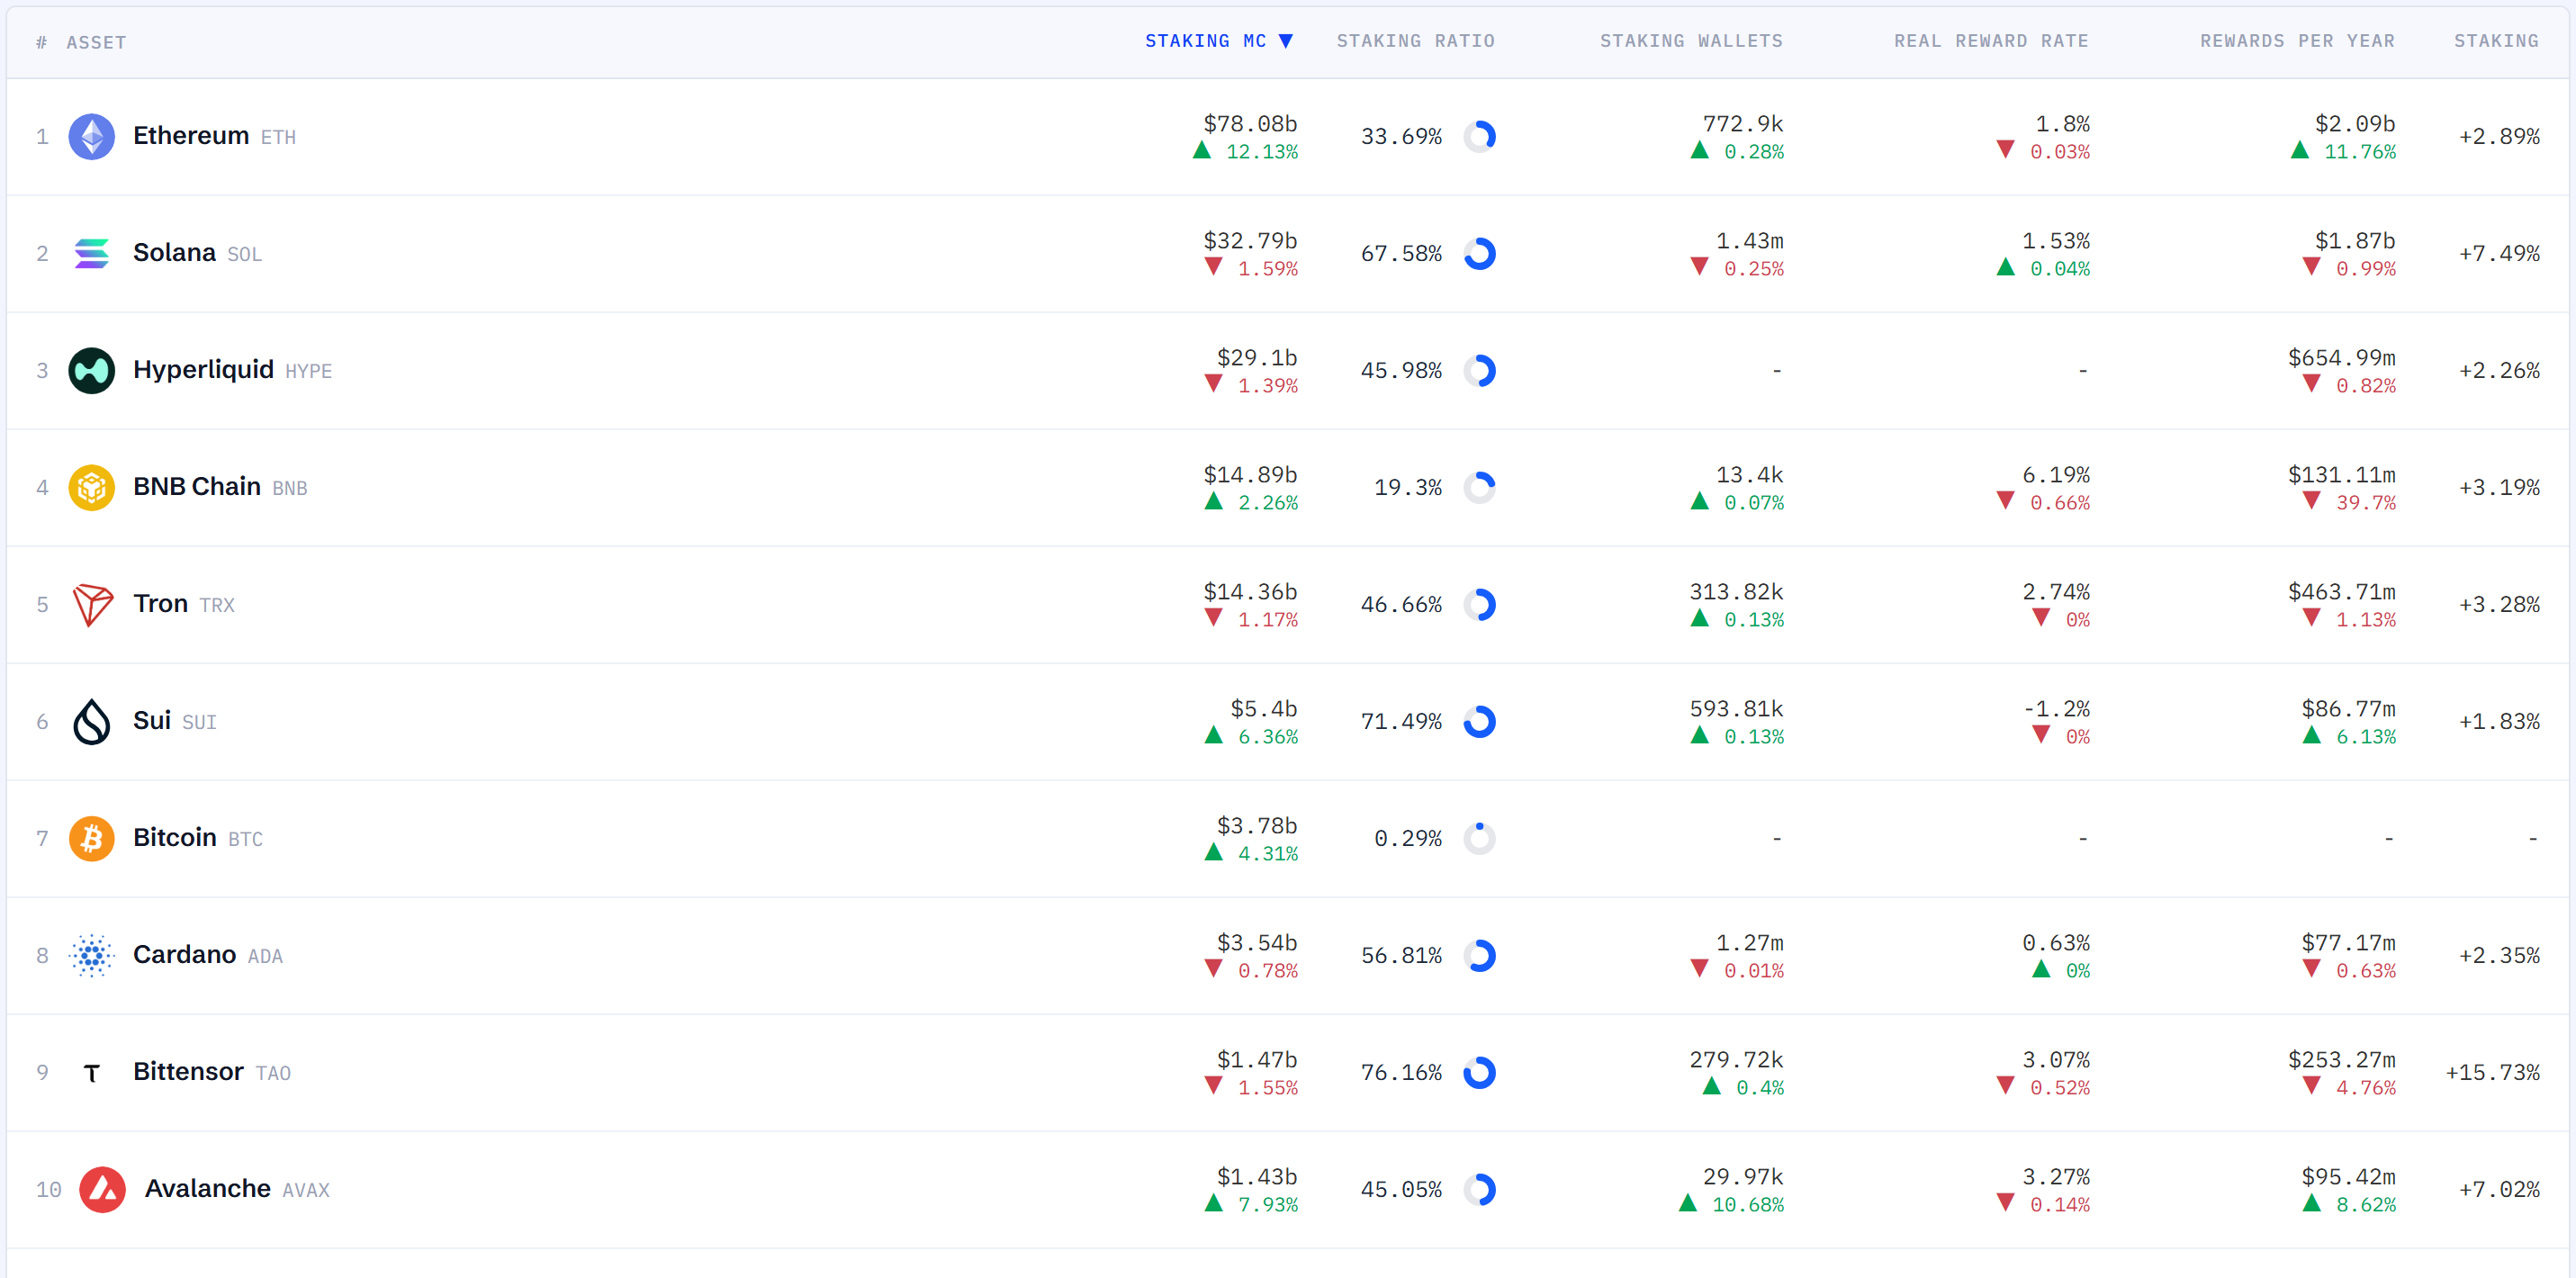
Sentiment gauges deteriorated further. The Crypto Fear & Greed Index fell to 15, firmly within 'extreme fear,' down from 16 a day earlier and 20 a week ago. At the same time, Bitcoin dominance declined 1.55% to 58.30%, implying a modest redistribution of capital toward altcoins even as overall risk appetite remains subdued.
Attention metrics were mixed. Google Trends interest for Bitcoin eased to 53 from 54 the prior day, suggesting slightly softer retail curiosity. However, on-chain activity improved: active wallets rose to 676,071 from 635,167, pointing to a recovery in network usage even amid price weakness.
Several liquidity and positioning indicators offered a nuanced picture. The Stablecoin Supply Ratio (SSR) rose 0.98% to 9.8663, often read as a marginal improvement in 'dry powder' conditions relative to Bitcoin’s price level. Net Unrealized Profit/Loss (NUPL) increased 0.88% to 0.1121, suggesting average investor profitability improved slightly—though the modest level indicates many market participants remain close to break-even, a zone that can amplify sensitivity to further downside moves.
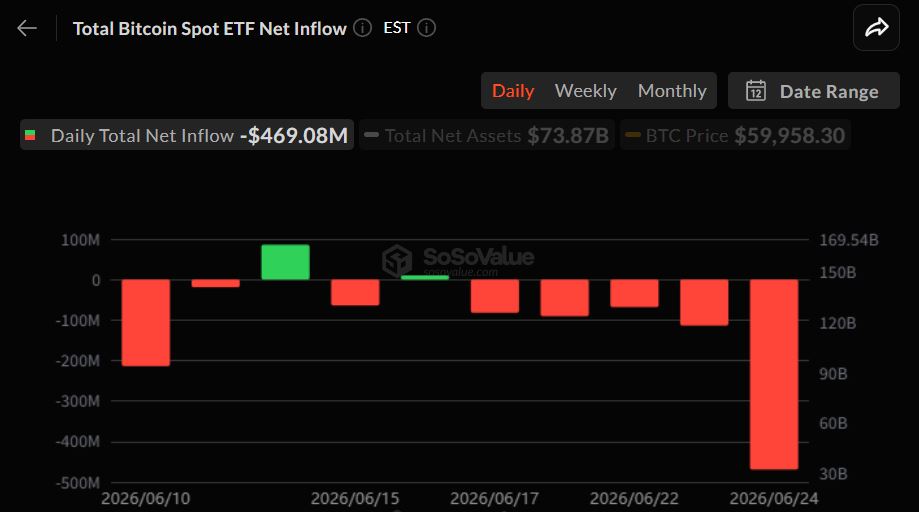
The most immediate short-term risk signal came from exchange data. Total exchange-held Bitcoin climbed 0.25% to roughly 2.703 million BTC, while net exchange flows increased to 6,745 BTC, up 2.78%. Rising exchange balances and positive net inflows are typically associated with growing 'sell-side availability,' as coins positioned on exchanges are easier to deploy for spot sales or collateral moves—conditions that can heighten volatility if price momentum stays fragile.
Bitcoin’s pullback toward the $59,800 area, combined with 'extreme fear' sentiment and increasing exchange inflows, highlights a market still searching for a durable floor. With on-chain activity improving but trend indicators remaining negative, the next phase will likely hinge on whether exchange inflows fade—signaling reduced sell pressure—or continue to build, elevating the risk of another sharp leg down.
🔎 Market Interpretation
- Price action: Bitcoin slipped to about $59,800 (around -2.7% day-over-day), extending a weak multi-session structure where declines dominated and the latest uptick looks more like a pause than a reversal.
- Volume confirms active repositioning: 24h spot volume rose to ~$43.97B (+2.12%), implying both dip-buying and risk-off selling/hedging are occurring, not simply low-liquidity drift.
- Macro backdrop not the driver: S&P 500 and gold were broadly steady, suggesting the move is crypto-specific (sentiment/positioning/liquidity) rather than a broad risk shock.
- Trend remains bearish: Daily and weekly MACD stayed deeply negative, consistent with overhead supply and rallies facing selling pressure.
- Sentiment at capitulation-like levels: Fear & Greed Index at 15 (Extreme Fear) signals fragile confidence and heightened sensitivity to additional downside catalysts.
- Rotation under the surface: BTC dominance fell to 58.30%, hinting at a small shift toward altcoins even while overall risk appetite remains muted.
- Network activity improving despite price weakness: Active wallets increased (676,071 vs. 635,167), a constructive divergence that could matter if sell-side pressure eases.
- Key near-term risk: Exchange-held BTC and net inflows rose (balances ~2.703M BTC; net flows +6,745 BTC), typically increasing sell-side availability and short-term volatility risk.
💡 Strategic Points
- Watch exchange flows as the primary trigger: If net inflows fade/turn negative, it may signal reduced immediate sell pressure; if inflows continue building, odds rise for another volatility spike or leg down.
- Interpret “Extreme Fear” as a volatility regime: Sentiment this low can support sharp bounces, but also accelerates liquidation/sell cascades if price breaks support—risk management matters more than prediction.
- Separate network strength from price trend: Rising active wallets is supportive, but with negative MACD, confirmation would likely require stabilization plus improving momentum, not activity alone.
- Use profitability metrics to gauge fragility: NUPL ~0.112 indicates many holders are near break-even—this zone can lead to fast supply hitting the market if price drops (to avoid losses), or reduced selling if price steadies.
- Liquidity “dry powder” is only slightly better: SSR ~9.87 rose marginally, suggesting stablecoin capacity relative to BTC price improved only a bit; it’s not yet a strong signal of overwhelming buy power.
- Scenario framing:
- Base case: Choppy consolidation while fear remains elevated and exchange flows decide direction.
- Bear case: Continued positive exchange inflows + weak momentum => renewed drawdown risk.
- Relief-rally case: Inflows cool + volume stays healthy + sentiment stabilizes => tradable bounce, though trend resistance may cap upside.
📘 Glossary
- Crypto Fear & Greed Index: A composite sentiment gauge; values near 0 indicate fear, near 100 indicate greed. 15 is categorized as Extreme Fear.
- MACD (Moving Average Convergence Divergence): A momentum/trend indicator. Negative MACD commonly suggests bearish momentum and tougher conditions for sustained rallies.
- Bitcoin Dominance: BTC’s share of total crypto market capitalization. A decline can imply rotation toward altcoins or BTC weakness relative to the broader market.
- Active Wallets: The number of addresses active on-chain over a period; often used as a proxy for network usage and participation.
- SSR (Stablecoin Supply Ratio): A metric comparing BTC market value to stablecoin supply; often interpreted as an estimate of available buying power (“dry powder”) relative to BTC price.
- NUPL (Net Unrealized Profit/Loss): Estimates whether the average holder is in profit or loss. Values near zero indicate many are near break-even, which can increase reactive selling or volatility.
- Exchange Reserves / Exchange-held BTC: The amount of BTC held on exchanges. Rising reserves can indicate greater potential sell supply.
- Net Exchange Flows: Net BTC moving into exchanges minus BTC moving out. Positive net flows often suggest increased readiness to sell or post collateral.


Comment 0