 News
News  Coin Information
  About us
  Customer Service


Solana (SOL) is drawing fresh attention from technical traders after holding a pronounced 'bullish divergence' despite a sharp recent sell-off—an indicator that often suggests downside momentum is fading. Analysts say the setup increases the odds of a consolidation phase, or a gradual rebound, over the coming days to weeks rather than another immediate leg lower.
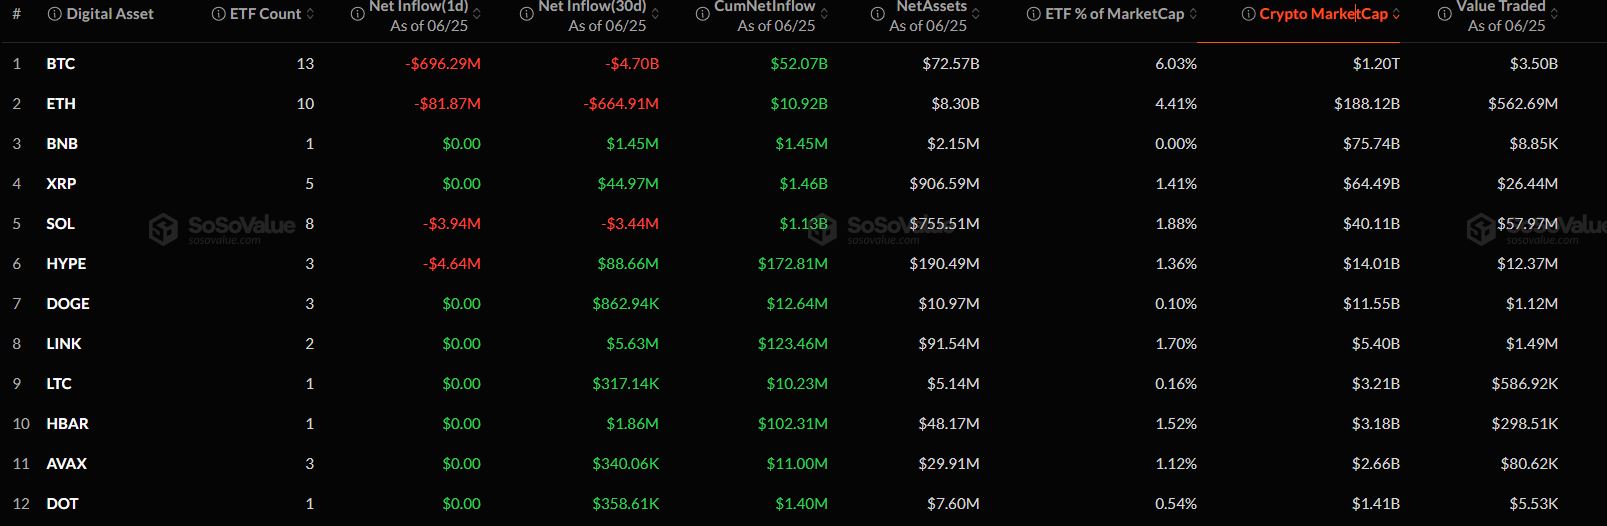
As of Saturday, June 27 at 5:05 a.m. ET (9:05 UTC), SOL traded at $71.85, up 5.75% over the past 24 hours. The token posted roughly $4.05 billion in 24-hour trading volume and carried a market capitalization near $41.72 billion, keeping it in the No. 7 spot by market value among cryptocurrencies.
A crypto market analyst pointed to a “large” bullish divergence visible on Solana’s three-day candlestick chart. In practical terms, 'bullish divergence' occurs when price prints lower lows while momentum indicators—such as RSI or MACD—begin forming higher lows. The pattern is widely interpreted as a sign that selling pressure is weakening even if price has not yet turned decisively higher.
While SOL has gained about 1.5% over the past week, it remains under pressure on broader timeframes. The token is down 11.05% over 30 days, and has slid 14.57% and 13.09% over the past 60 and 90 days, respectively—reflecting a sustained medium-term correction despite periodic relief rallies.
Key levels are now coming into sharper focus. On the upside, analysts flagged the $75 to $80 area as a heavy 'resistance' zone that could cap any near-term bounce and serve as a pivotal test of market conviction. On the downside, the $61 region has been identified as an important 'support' level on the 12-hour chart. A clean break below that floor could amplify liquidation risk and invite a deeper drawdown as traders reassess positioning.
With SOL currently trading between those boundaries, market participants are watching whether price can reclaim the $75 handle—or alternatively, whether sellers can force a retest of the low-$60s. Until one side gives way, the prevailing expectation among chart-focused commentators is for range-bound trading punctuated by short-lived spikes in volatility.
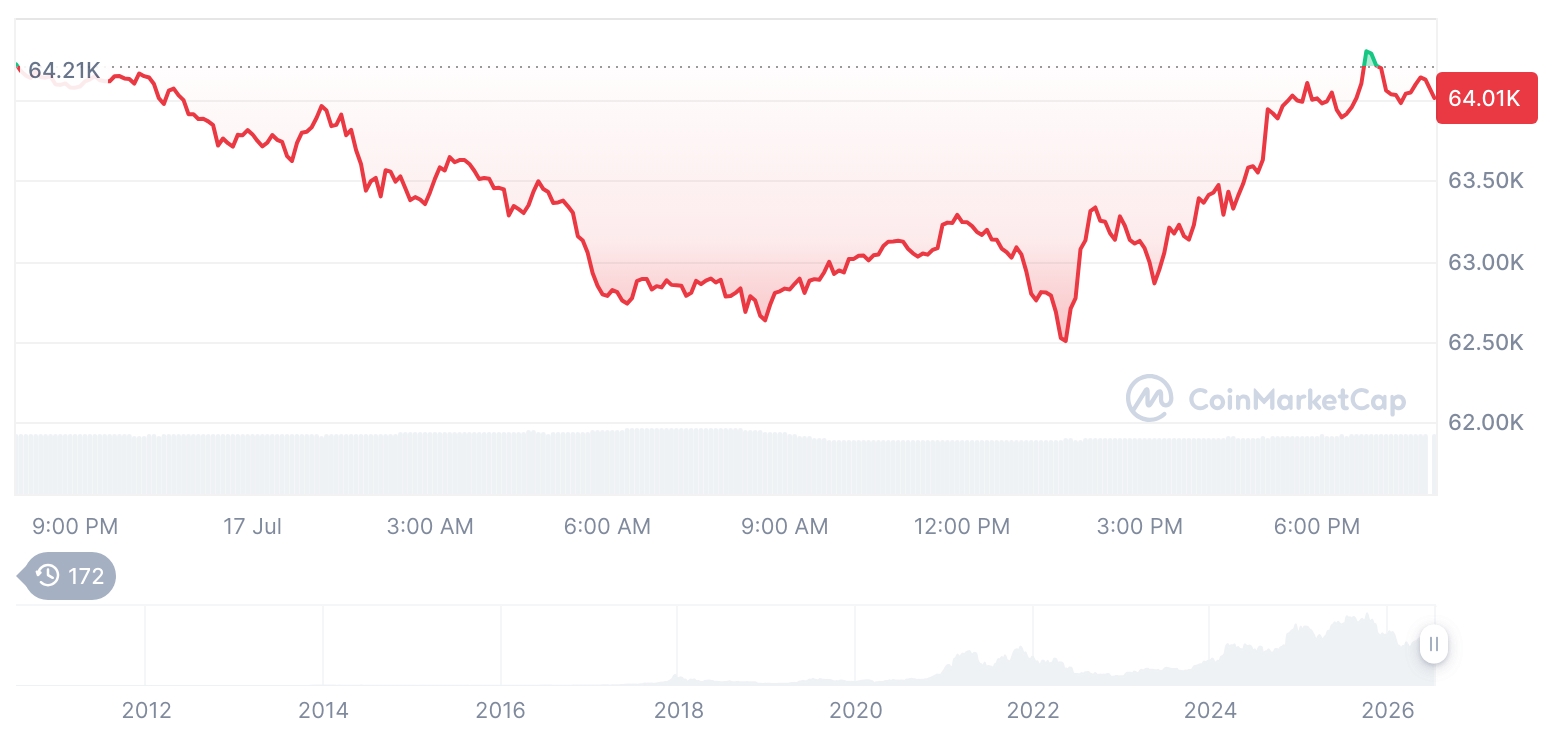
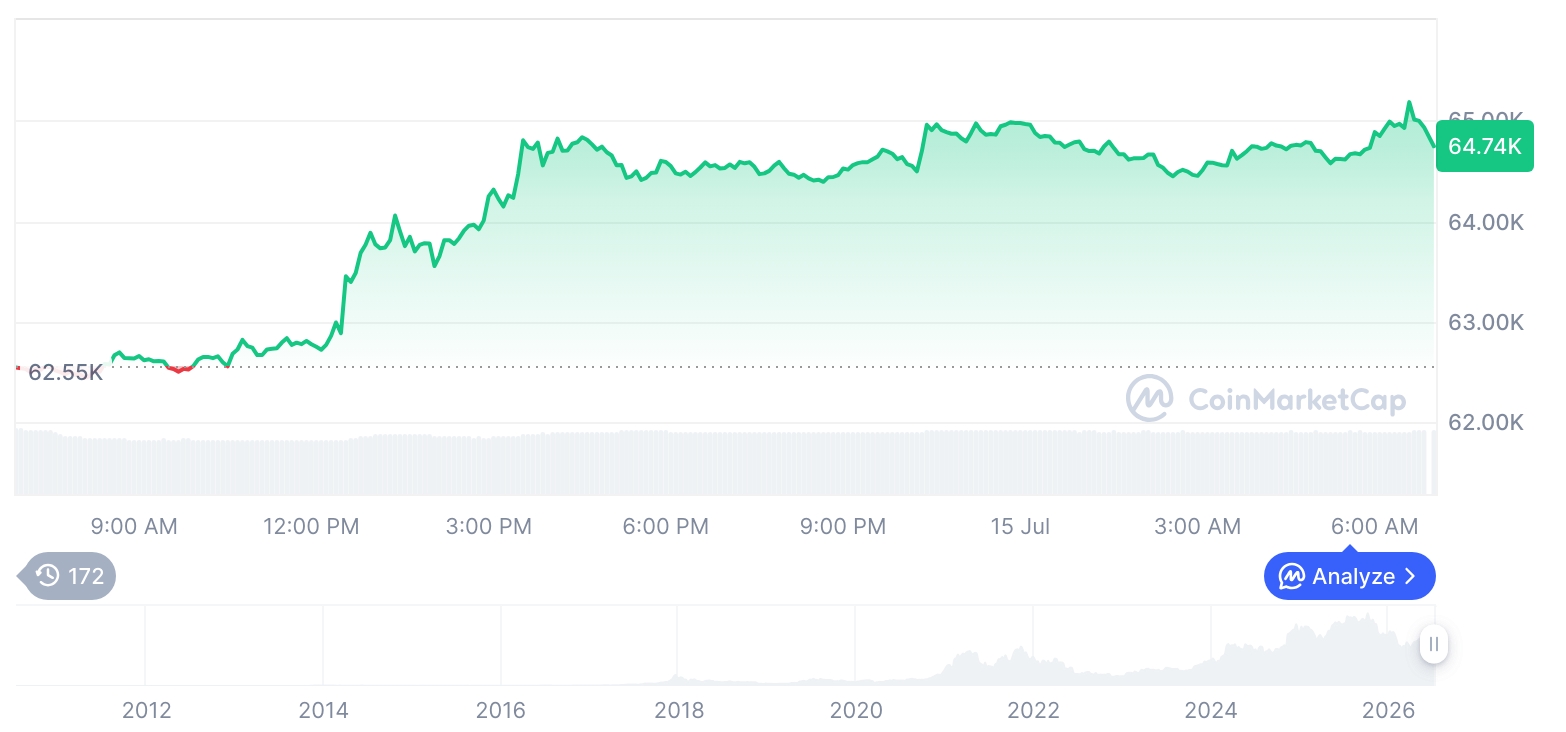
Broader market direction, particularly Bitcoin (BTC), remains a central variable. Bitcoin has been hovering slightly above the $60,000 level, and some analysts see room for a near-term rebound. If BTC stabilizes and grinds higher, it could improve risk appetite across large-cap altcoins, including Solana, reinforcing the case for consolidation rather than cascading declines.
Notably, the latest move appears driven more by technical positioning and market-wide sentiment than by Solana-specific fundamentals. Major outlets have not reported new developments tied to Solana’s ecosystem—such as network upgrades, flagship dApp launches, regulatory actions, or official roadmap changes—leaving price action to be shaped primarily by flows, leverage, and Bitcoin-led momentum.
For the wider crypto market, Solana’s resilience in the face of recent selling is being read as a temperature check on risk tolerance. Whether the divergence translates into a sustained recovery will likely depend on how the market responds at the $75–$80 ceiling and the $61 floor, as well as Bitcoin’s ability to hold key psychological levels in the days ahead.
🔎 Market Interpretation
- Technical signal in focus: Solana is showing a pronounced bullish divergence on the 3-day chart, implying downside momentum may be weakening even though the broader trend has been corrective.
- Near-term bias: Analysts lean toward consolidation or a gradual rebound over days to weeks, rather than an immediate continuation lower—unless key support breaks.
- Current positioning: SOL is trading between major levels, which supports a range-bound interpretation with intermittent volatility spikes.
- Trend context: Despite a +24h bounce, SOL remains down on higher timeframes (30/60/90 days), signaling a medium-term correction still in effect.
- Macro driver: Bitcoin near $60,000 is framed as the main variable; BTC stability could lift risk appetite and help SOL base, while BTC weakness could pressure support.
- Fundamentals quiet: No major Solana-specific catalysts (upgrades, flagship launches, regulatory shocks) are cited; price action is described as driven mainly by flows, leverage, and sentiment.
💡 Strategic Points
- Key resistance test ($75–$80): This zone is highlighted as a heavy supply area. A sustained reclaim could shift sentiment toward a more durable rebound; repeated rejection supports continued range trading.
- Key support level ($61): Identified as an important floor on the 12-hour chart. A clean breakdown may increase liquidation risk and open the door to a deeper drawdown.
- Base-case scenario: While price remains between $61 support and $75–$80 resistance, expect choppy, two-sided trade and volatility around level retests.
- Confirmation checklist:
- Bullish: Hold above higher lows + regain/hold above $75, with improving momentum (RSI/MACD) confirming the divergence.
- Bearish: Failure to reclaim $75 followed by a decisive break below $61, suggesting the divergence failed and sellers regained control.
- BTC sensitivity: Monitor BTC’s behavior around the psychological $60k area; BTC stabilization tends to support large-cap altcoins, while BTC sell-offs can rapidly invalidate altcoin basing setups.
- Risk framing: The article emphasizes technical positioning and leverage dynamics—conditions that can produce fast moves in either direction even inside a range.
📘 Glossary
- Bullish divergence: When price makes lower lows but a momentum indicator (e.g., RSI/MACD) makes higher lows, often interpreted as waning selling momentum.
- RSI (Relative Strength Index): A momentum oscillator that gauges the speed/magnitude of recent price changes to indicate overbought/oversold conditions and momentum shifts.
- MACD (Moving Average Convergence Divergence): A trend/momentum indicator derived from moving averages; changes can hint at momentum turning points.
- Candlestick chart (3-day): A chart where each candle represents three days of price data, useful for spotting broader swing signals.
- Support: A price area where buying interest historically emerges, sometimes acting as a floor; breaks can accelerate downside.
- Resistance: A price area where selling interest historically appears, sometimes acting as a ceiling; breakouts can accelerate upside.
- Consolidation: Sideways trading where price stabilizes within a range as buyers and sellers reach temporary balance.
- Liquidation risk: The chance leveraged traders are forcibly closed out when price moves against them, which can amplify volatility.


Comment 0