

 News
News  Coin Information
  About us
  Customer Service


 Add as a preferred source on Google
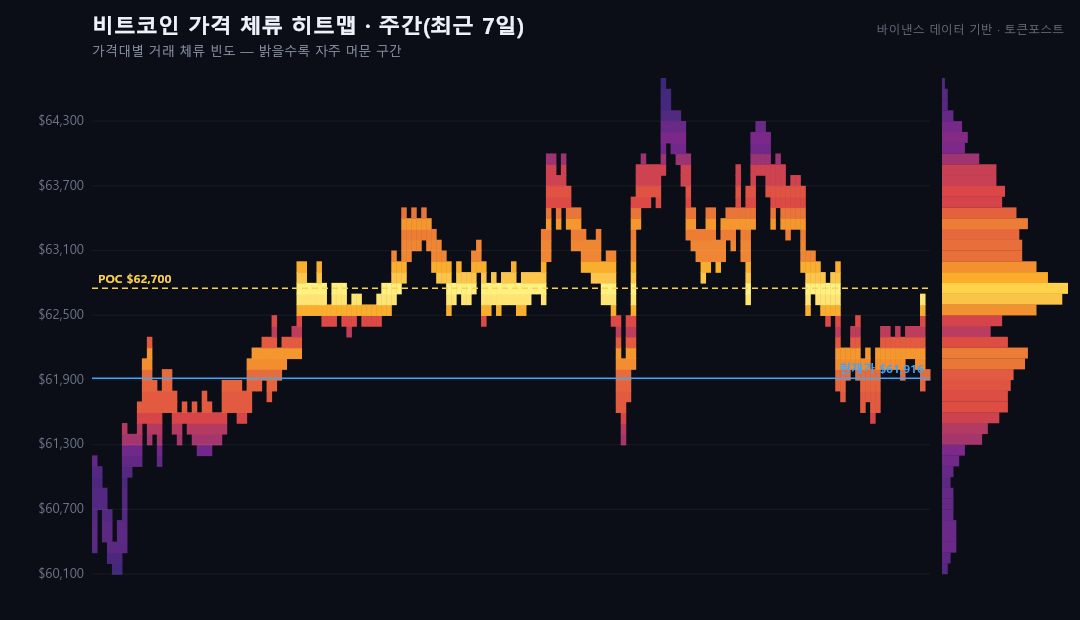
Bitcoin (BTC) is hovering near a key support zone after a steep pullback from its record high, with market positioning suggesting a short-term equilibrium but little conviction. Traders are now watching whether BTC can reclaim the dense supply around $62,700—an area that analysts see as the pivotal hurdle for any sustained rebound.
As of Wednesday 15:00 UTC, Bitcoin was trading around $61,916 on Binance, sitting just above the weekly lower support band at $61,300–$61,900. The price has remained range-bound over the past week, oscillating between roughly $60,100 and $64,700, reflecting a market that is consolidating rather than trending.
Market profile data based on Binance trading shows the weekly 'point of control' (POC)—the price level with the highest concentration of traded volume—near $62,700. In practical terms, the POC often represents the market’s perceived 'fair value' during the period, because it marks where the largest amount of trading activity occurred. BTC is currently trading below that weekly volume center, indicating that recent buying interest has not yet been strong enough to pull price back through the most heavily trafficked zone.
Overhead, the thickest weekly supply is concentrated in the $62,500–$63,500 region, overlapping with the $62,700 POC. This confluence creates what many traders describe as an 'overhead supply' wall: participants who accumulated in that area may be inclined to sell into rallies to reduce exposure, making a clean breakout more difficult unless fresh spot demand enters the market.
On the downside, the $61,300–$61,900 band stands out as a meaningful weekly support cluster. Sustained acceptance above this range would support the view that BTC is building a base. A breakdown, however, would put the lower end of the weekly range near $60,100 back into focus.
Shorter-term positioning tells a similar story. The 24-hour heatmap places the strongest POC near $62,100, with the heaviest near-term supply sitting around $62,000–$62,350. With BTC trading just below that zone, price action suggests the market is repeatedly probing into nearby liquidity but failing to secure a decisive foothold above it.
Nearby 24-hour support is concentrated around $61,750–$61,900, reinforcing the same lower band highlighted on the weekly view. In market profile terms, this creates a narrow corridor where buyers appear willing to defend, at least for now, while sellers remain active overhead.
In cycle terms, Bitcoin remains deep in a post-peak drawdown. At $61,916, BTC is down approximately 50.88% from its all-time high of $126,038, slightly improved versus the prior week’s 51.16% drawdown. Even with that decline, the asset is still up roughly 293% from the cycle low of $15,770 recorded on Nov. 21, 2022, underscoring how sharply the market has appreciated since the last capitulation phase despite the recent retracement.
Relative to the fourth halving on April 20, 2024, Bitcoin is trading about 3.03% below its halving-day price of $63,850. That places BTC marginally under its post-halving reference level, a point that some market participants track as a rough sentiment marker when assessing whether the market is in an accumulation phase or struggling to attract new marginal buyers.
For now, the immediate technical picture hinges on whether Bitcoin can regain the 'volume bulge' around $62,700 and then hold above the $62,500–$63,500 supply zone. A convincing move through that area would signal improving risk appetite and a potential shift in short-term market control, while continued rejection would keep BTC pinned near support and vulnerable to another test of the lower boundary of the weekly range.
🔎 Market Interpretation
{
"market_state": [
{
"theme": "Consolidation after sharp pullback",
"detail": "BTC is range-bound (~$60,100–$64,700) and hovering just above a key weekly support band ($61,300–$61,900), signaling short-term balance rather than a directional trend."
},
{
"theme": "Fair-value magnet sits higher",
"detail": "Weekly Market Profile POC (highest traded volume) is near $62,700. Trading below it implies buyers have not yet regained control of the most accepted price area."
},
{
"theme": "Overhead supply remains the main obstacle",
"detail": "The densest weekly supply is concentrated at $62,500–$63,500 (overlapping the $62,700 POC). Prior participants may sell into rallies, creating a resistance wall unless new spot demand overwhelms supply."
},
{
"theme": "Intraday structure echoes the weekly picture",
"detail": "24h POC near $62,100 with near-term supply around $62,000–$62,350; price repeatedly tests this liquidity but fails to hold above it, reinforcing a 'rejection' pattern."
},
{
"theme": "Cycle context: deep drawdown but strong multi-year rebound",
"detail": "BTC is ~50.88% below the stated all-time high ($126,038) yet ~293% above the cycle low ($15,770 on Nov 21, 2022), indicating a large retracement within a broader recovery."
},
{
"theme": "Post-halving reference slightly negative",
"detail": "BTC is ~3.03% below the April 20, 2024 halving-day price ($63,850), a mild bearish-to-neutral sentiment marker versus that reference level."
}
],
"key_levels": {
"resistance": [
{
"level": "$62,700",
"why_it_matters": "Weekly POC / volume bulge (market 'fair value'); reclaiming it is the first step to shifting short-term control."
},
{
"zone": "$62,500–$63,500",
"why_it_matters": "Thickest weekly overhead supply; breakout/acceptance above needed for a sustained rebound."
},
{
"zone": "$62,000–$62,350",
"why_it_matters": "Heaviest 24h supply; repeated failure here suggests near-term sellers remain active."
}
],
"support": [
{
"zone": "$61,300–$61,900",
"why_it_matters": "Weekly lower support cluster; holding indicates base-building and reduces immediate downside risk."
},
{
"zone": "$61,750–$61,900",
"why_it_matters": "24h support concentration; defines the near-term 'defense line' for buyers."
},
{
"level": "~$60,100",
"why_it_matters": "Lower end of the weekly range; becomes the next downside target if support fails."
}
]
},
"what_to_watch_next": [
{
"signal": "Bullish confirmation",
"condition": "Regain $62,700 and show acceptance above $62,500–$63,500 (hold above after breakout).",
"implication": "Improving risk appetite and a potential transition from consolidation to rebound."
},
{
"signal": "Bearish continuation risk",
"condition": "Repeated rejection under $62,000–$62,350 followed by loss of $61,300–$61,900 support.",
"implication": "Higher odds of revisiting ~$60,100 and extending the range to the downside."
}
]
}
💡 Strategic Points
{
"trade_planning_insights": [
{
"point": "Treat $61,300–$61,900 as the 'line in the sand'",
"how_to_use": "If price sustains above it, conditions favor mean-reversion attempts toward the POC; if it breaks, downside momentum may accelerate toward ~$60,100."
},
{
"point": "POC reclaim is more important than a single wick",
"how_to_use": "Look for closes/acceptance above $62,700 and follow-through through $62,500–$63,500; without acceptance, rallies may be sellable bounces into supply."
},
{
"point": "Expect choppiness inside the value area",
"how_to_use": "With heavy volume nodes nearby ($62,100–$62,700), short-term moves can revert quickly; risk controls matter more than big directional bets until a breakout/breakdown occurs."
},
{
"point": "Use the range as a decision framework",
"how_to_use": "Range top (~$64,700) and range bottom (~$60,100) define the current auction extremes; price near the middle (POC region) often implies lower edge for directional conviction."
},
{
"point": "Context check: post-halving and drawdown signals are mixed",
"how_to_use": "Being slightly below halving-day price and deeply off ATH suggests caution; still far above cycle low suggests structural strength—timing hinges on reclaiming supply zones."
}
],
"scenarios": {
"base_case": {
"description": "Continued consolidation between support ($61,300–$61,900) and supply ($62,500–$63,500).",
"typical_behavior": "Frequent probes above $62k that fail unless fresh spot demand appears."
},
"upside_case": {
"description": "Break and hold above $62,700 then clear $63,500.",
"typical_behavior": "Sellers from the supply zone get absorbed; market may rotate to higher value areas within/above the weekly range."
},
"downside_case": {
"description": "Lose $61,300 support and accept below it.",
"typical_behavior": "Rotation toward the weekly low (~$60,100), with volatility increasing as stops/liquidations cluster."
}
}
}
📘 Glossary
{
"terms": [
{
"term": "Support zone",
"definition": "A price area where buying interest historically increases, often slowing or reversing declines."
},
{
"term": "Resistance / Overhead supply",
"definition": "A price area where selling pressure tends to appear, often from traders looking to exit at breakeven or reduce risk after buying earlier in the zone."
},
{
"term": "Market Profile",
"definition": "A framework that maps where trading activity (volume or time) concentrates across price, helping identify value areas, supply/demand zones, and rotational behavior."
},
{
"term": "Point of Control (POC)",
"definition": "The price level with the highest traded volume (or time) in the profile; often treated as the period’s 'fair value' or the most accepted price."
},
{
"term": "Acceptance",
"definition": "When price holds and builds volume above/below a level rather than quickly rejecting it—often used to validate breakouts or breakdowns."
},
{
"term": "Confluence",
"definition": "When multiple signals/levels overlap (e.g., POC + supply zone), increasing the likelihood the area matters to traders."
},
{
"term": "Drawdown",
"definition": "The percentage decline from a prior peak (e.g., all-time high) to the current price."
},
{
"term": "Halving-day price reference",
"definition": "The BTC price on the halving date, sometimes used as a sentiment or regime marker for post-halving performance."
}
]
}




















Comment 0