
 Add as a preferred source on Google
Global M2 Liquidity Tops $120 Trillion as Short-Term Growth Slows, Testing Crypto Tailwinds
Global M2 liquidity remained above $120 trillion but short-term growth slowed while ETF inflows and Bitcoin indicators showed balanced market conditions.



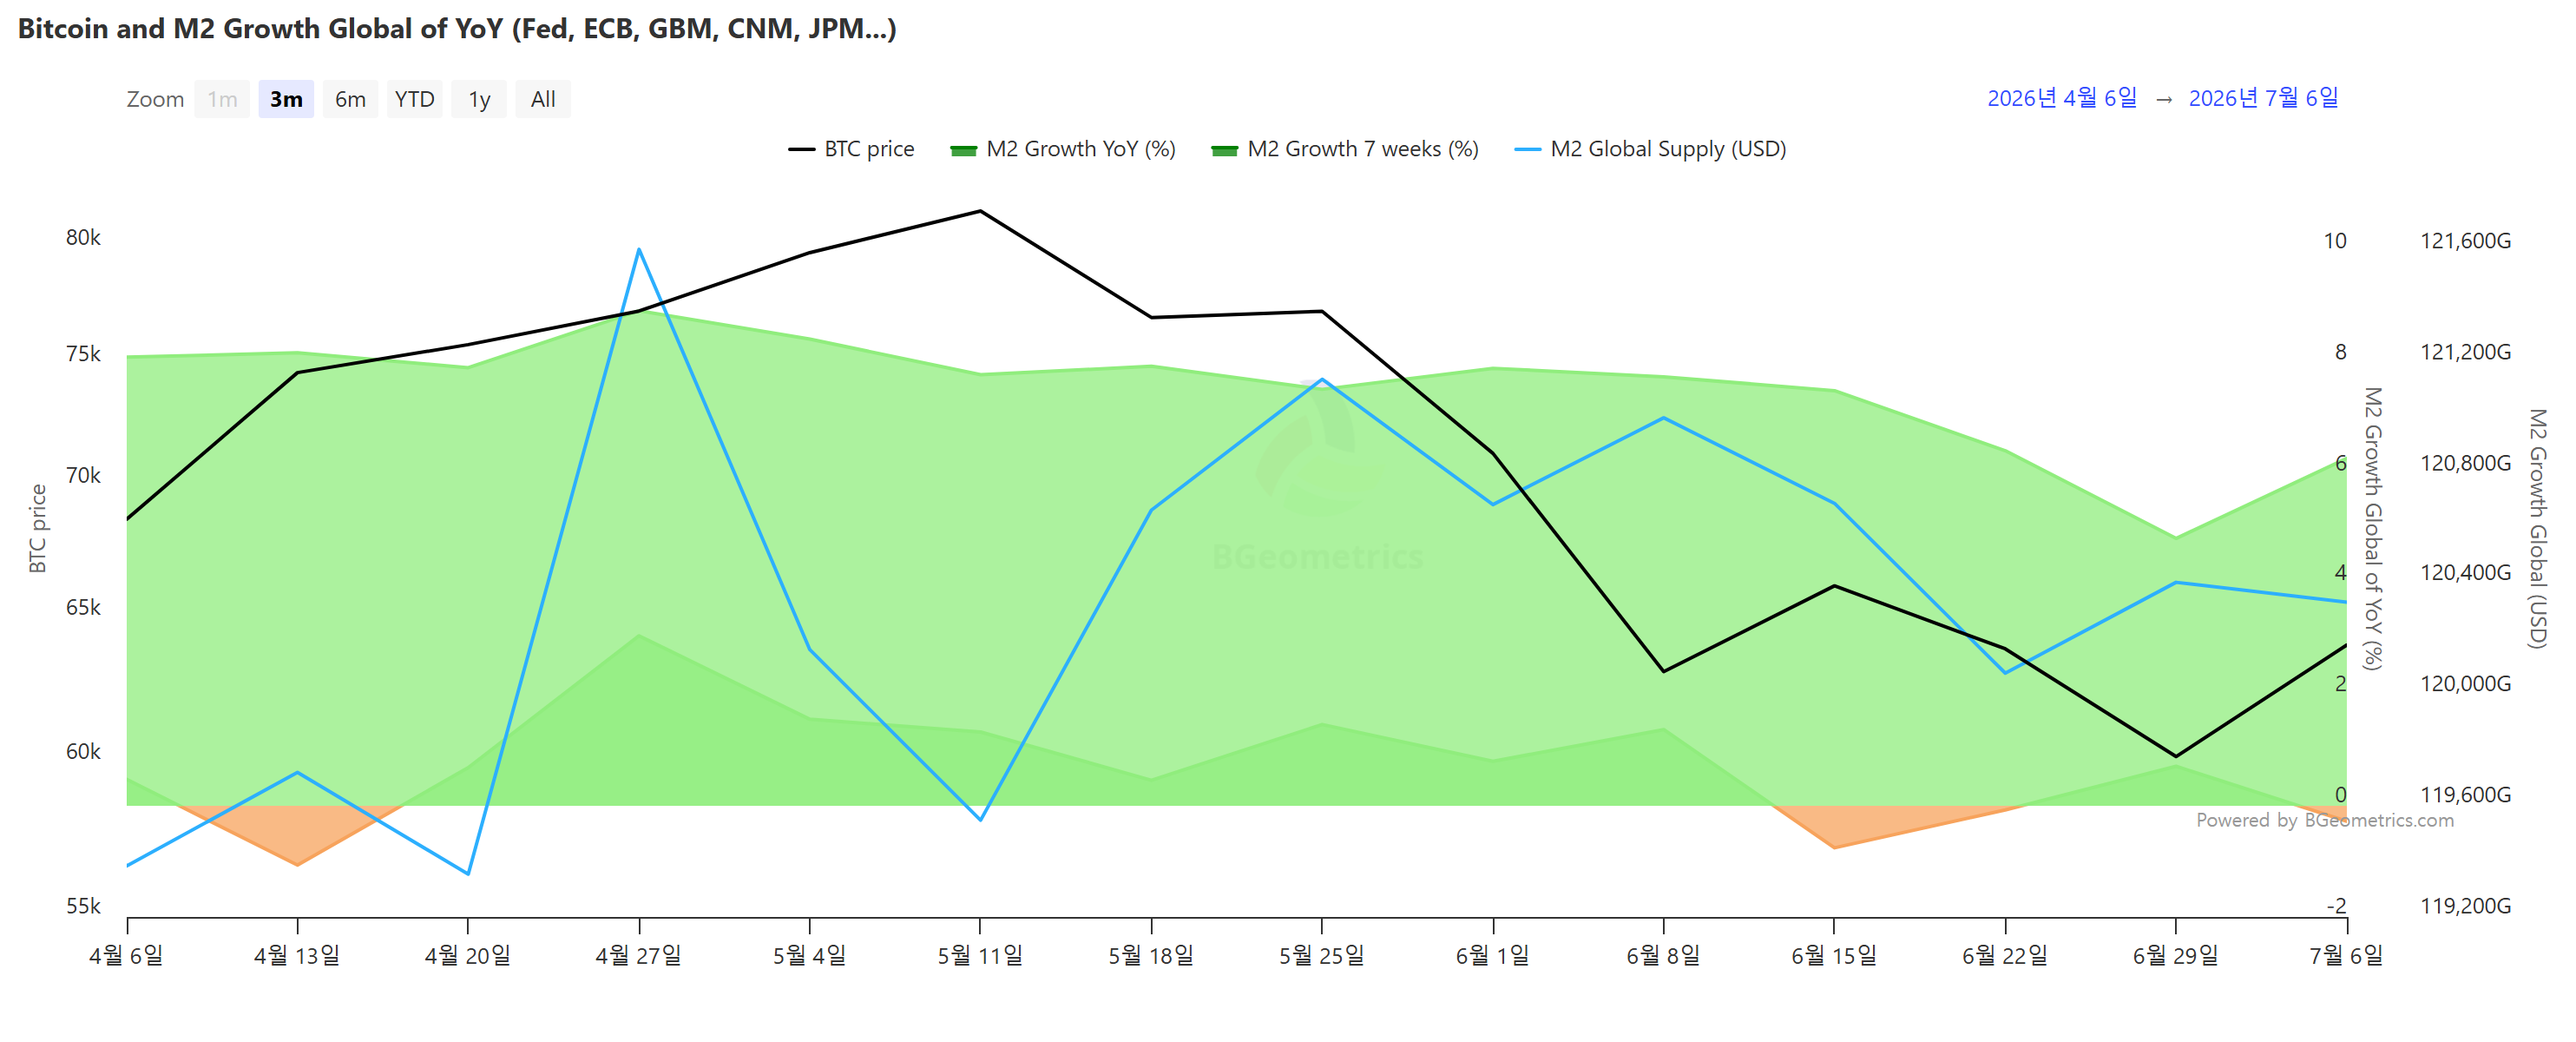
Global liquidity remains above the psychologically important $120 trillion level, but short-term momentum has cooled—an evolution that matters for crypto markets that have historically tracked broad money growth with a lag.
According to data compiled by BizioMetrics, global M2 money supply totaled $120.3356 trillion as of July 6, down roughly 0.06% from $120.4070 trillion a week earlier (June 29). While the pullback was modest, the recent pace of change suggests a clearer slowdown: the seven-week M2 growth rate came in at -0.27%, easing from 0.72% the prior week, pointing to softer near-term 'liquidity flow' conditions.
At the same time, the longer-term picture has firmed. Year-over-year global M2 growth was measured at 6.27%, up 1.44 percentage points from 4.83% the week before, indicating that annual liquidity expansion has broadened even as weekly impulses weaken.
For crypto investors, the mix is notable because Bitcoin (BTC) has often behaved as a 'liquidity barometer', with analysts frequently citing a tendency for BTC prices to reflect changes in M2 with an estimated lag of around 10 weeks. A decelerating short-term liquidity impulse can reduce immediate tailwinds for risk assets, while stronger year-on-year growth can support the medium-term narrative that macro liquidity is still expanding.
On-chain and fund-flow indicators meanwhile painted a more balanced market posture. Bitcoin’s MVRV Z-score—a valuation gauge comparing market capitalization to realized value—stood at 0.36, up from 0.23 a week earlier. The uptick suggests valuation has risen at the margin, but the metric remains within the 0–2 'neutral' zone that typically reflects neither overheating nor deep undervaluation.
Long-term holder behavior also remained steady. The 1+ Year HODL wave, which tracks the share of BTC that has not moved for at least a year, edged up to 61.93% from 61.90%. With more than 60% of supply still effectively dormant, analysts generally interpret the reading as evidence of persistent 'structural supply lock-up'—a condition that can amplify price moves when incremental demand returns.
That demand signal has begun to reappear in U.S. spot crypto ETFs. Data from SosoValue showed that, as of July 6 U.S. Eastern Time, U.S. spot Bitcoin ETFs recorded net daily inflows of $265.69 million, while spot Ethereum (ETH) ETFs posted $20.66 million in net inflows. Bitcoin ETFs have now seen inflows for two consecutive trading days, with Ethereum ETFs extending the streak to three days.
In combination, the data suggest a market navigating mixed macro signals: softer short-term global liquidity growth alongside firmer year-on-year expansion, neutral on-chain valuation, steady long-term holding patterns, and a tentative revival of 'institutional demand' through spot ETF inflows. How durable those ETF flows prove to be may determine whether crypto can sustain momentum even if global liquidity impulses remain subdued in the near term.