 News
News  Coin Information
  About us


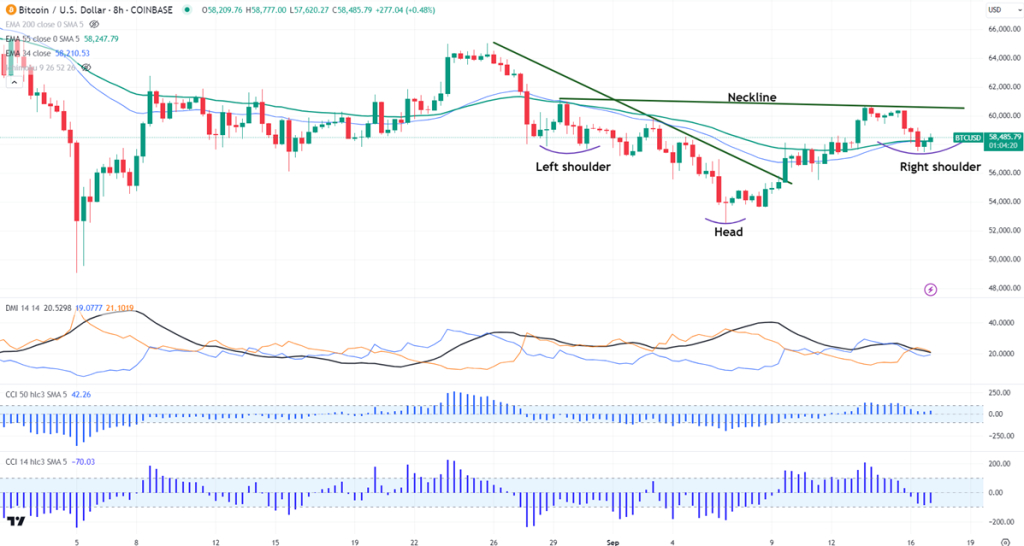
Chart pattern- Inverted Head and Shoulder
Potential reversal zone- $52530.
BTCUSD showed a minor jump of nearly $1000 from a minor bottom of $57477. It hit a high of $58777 and is currently trading at around $58506.
According to the CME Fed watch tool, the probability of a 50 bpbs rate cut in Sep increased to 67% from 30% a week ago.
US markets -
NASDAQ (No correlation with BTC) - Bearish (neutral for BTC). The NASDAQ trades high as markets expect 50 bpbs rate cut this Wednesday. Any close above 20000 will take the index to 20500.
Technicals-
BTCUSD trades above the short-term moving average 34- EMA below 55 EMA and the long-term moving average (200 EMA) in the 4-hour chart.
Minor support- $57000. Any break below will take it to the next level at $55000/$52500/$50000/$46000.
Bull case-
Primary supply zone -$60800. Any break above confirms an intraday bullishness. A jump to $61800/$63000/$65000/$67000/$70000 is possible.
Secondary barrier- $70000. A close above that barrier targets $750000/$80000.
Indicator (8-hour chart)
CCI (14)- Bearish
CCI (50)- Bullish
Average directional movement Index - Neutral
It is good to buy on dips around $57500-550 with SL around $52000 for TP of $70000.


Comment 0