 News
News  Coin Information
  About us
  Customer Service


ETH/USD chart - Trading View
Exchange - Coinbase
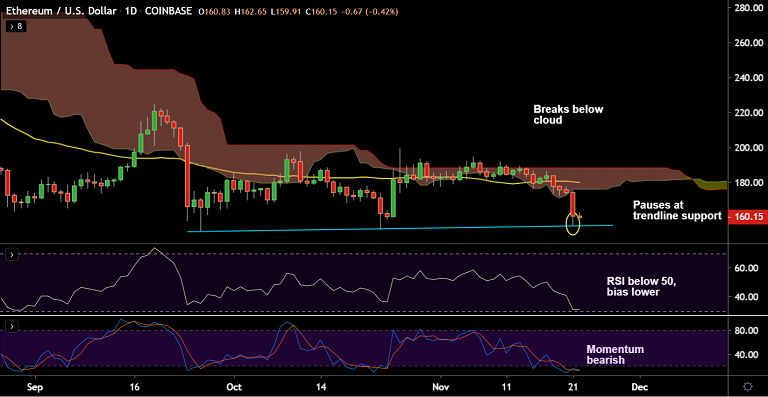
Support: 155 (Trendline); Resistance: 169.66 (5-DMA)
Technical Analysis: Bias Bearish
ETH/USD is consolidating previous session's slump, bias strongly bearish.
The pair was trading at 159.56 at 05:50 GMT, down 0.83% at the time of writing.
Price action has shown a clear break below daily cloud raising scope for further weakness.
Downside has paused at strong trendline support at $155 mark, break below will see further weakness.
Technical indicators are biased lower, volatility is rising as evidenced by widening Bollinger bands.
However, oscillators are at oversold levels and price is extending below lower Bollinger band, some consolidation likely.
Break below trendline ($155) eyes next immediate support at 153 (Oct 23 low) ahead of 146 (Apr 25 low).


Comment 0