

 News
News  Coin Information
  About us
  Customer Service


 Add as a preferred source on Google
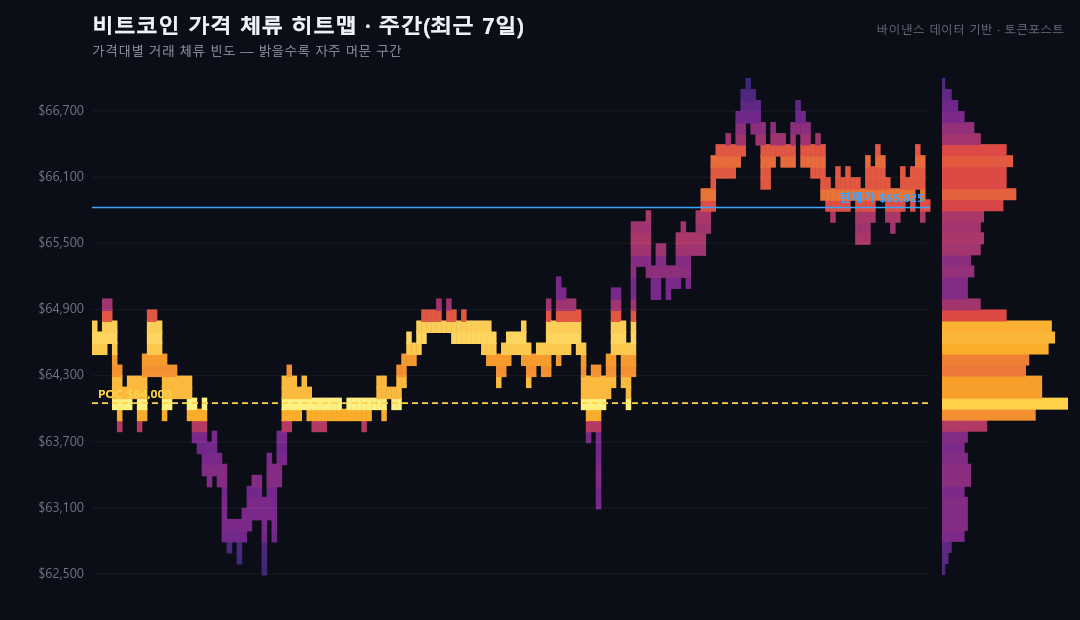
Bitcoin (BTC) is hovering in the mid-$65,000 range, and traders are increasingly focused on whether the market can hold the psychologically important $65,000 area—or reclaim a heavy supply zone near $65,900 that could determine near-term direction.
As of Wednesday ET, BTC was trading around $65,825, according to Binance data cited in a weekly price ‘residence’ heatmap analysis. The asset remains down about 47.77% from its prior all-time high of $126,038, but it is also sitting near the top of this week’s observed range of roughly $62,500 to $67,000, suggesting a market that is consolidating rather than trending decisively.
The heatmap approach highlights where trading activity has been most concentrated—often referred to as the ‘point of control’ (POC), a commonly used market profile level that can signal zones of perceived ‘fair value’ and strong two-way liquidity. In practical terms, these regions frequently become battlegrounds for support and resistance as participants defend average entry prices and large resting orders.
On the weekly view, the strongest ‘POC’ was identified near $64,000, marking the price area with the densest trading activity over the past seven days. BTC currently trades slightly above that level, indicating that bulls still have some control over the week’s value area. However, analysts tracking order-distribution metrics are watching $65,000 as a confirmation zone: a sustained break below could expose the market to a retest of lower high-volume bands around $63,900 to $64,900, where significant transactions were also recorded.
To the upside, the data points to a thick band of overhead supply between roughly $65,900 and $66,500. In particular, $65,900 stands out as a key ‘sell wall’—a level where accumulated volume may translate into faster profit-taking and stronger resistance. A clean push through that zone would signal that buyers are absorbing supply, potentially opening room for a move toward the upper end of the weekly range near $67,000.
The shorter-term, 24-hour heatmap paints a similar picture of indecision. The most active ‘POC’ over the past day sits near $65,950, while BTC has been trading slightly below it, suggesting that sellers have been able to defend the immediate value node. The heaviest near-term supply is clustered between approximately $65,850 and $66,100, again emphasizing the importance of the $65,950–$65,900 region as a first hurdle for any rebound attempt. On the downside, the $65,750–$65,800 band shows notable transaction density, implying a potential near-term footing if volatility spikes.
Beyond intraday positioning, longer-cycle metrics underscore how far the market has retraced from peak levels while still maintaining substantial gains since the last major bottom. BTC’s drawdown from the previous record high has narrowed slightly compared with last week’s 49.36% decline, indicating modest stabilization even as the broader correction remains deep by historical standards.
Bitcoin has also drifted only marginally above its level at the fourth halving on April 20, 2024, up about 3.09% from the halving-day price near $63,850 based on the figures cited in the report. That relatively muted post-halving appreciation contrasts with more explosive advances seen in some past cycles, reinforcing the view that liquidity conditions, macro sensitivity, and a more institutionally dominated market structure may be shaping a slower, more range-bound phase.
At the same time, the longer arc remains positive: from the cycle low near $15,770 recorded on Nov. 21, 2022, BTC is still up roughly 317%. The combination of a steep peak-to-trough correction from the high and a strong multi-year recovery from the low illustrates a market at a pivot point—one where near-term positioning around $65,000 and the ‘$65,900’ supply wall may drive short-term price action, while the broader cycle continues to be judged against post-halving expectations and risk appetite across global markets.
🔎 Market Interpretation
- Current posture: Bitcoin is consolidating in the mid-$65,000s, trading near the top of this week’s ~$62,500–$67,000 range rather than showing a decisive trend.
- Key psychological level: $65,000 is framed as the market’s near-term “line in the sand.” Holding it supports a neutral-to-bullish consolidation; losing it increases odds of a pullback into lower high-volume zones.
- Weekly value focus: The weekly Point of Control (POC) is ~$64,000, indicating the highest trade concentration (a “fair value” anchor). BTC trading above it suggests bulls retain marginal control of the week’s value area.
- Overhead supply/resistance: A heavy supply band sits around $65,900–$66,500, with $65,900 highlighted as a major “sell wall” that could cap rallies via faster profit-taking.
- 24-hour micro-structure: The daily POC is ~$65,950. BTC trading slightly below that node signals sellers are defending the immediate value area; short-term supply is clustered around $65,850–$66,100.
- Downside liquidity pockets: If $65,000 fails, the report flags a likely retest of high-volume bands around $63,900–$64,900. Intraday, $65,750–$65,800 shows notable density as a possible near-term footing.
- Cycle context: BTC is still about 47.77% below its cited prior ATH ($126,038), but the drawdown has improved slightly vs. last week (49.36%), hinting at stabilization within a broader correction.
- Post-halving behavior: Price is only ~3.09% above the April 20, 2024 halving level (~$63,850), implying a slower, more range-bound phase than some prior cycles—potentially due to liquidity/macro sensitivity and institutional market structure.
- Long-term trend remains constructive: Despite the correction from the peak, BTC is still up ~317% from the Nov. 21, 2022 cycle low (~$15,770), emphasizing a market at a pivot between consolidation and breakout/breakdown.
💡 Strategic Points
- Primary decision zone: Watch $65,000 for acceptance (holding/closing above) vs. rejection (sustained break below). This level is positioned as the validation point for near-term bias.
- Upside trigger: A “clean push” and acceptance above $65,900–$66,100 (clearing the sell wall / near-term supply cluster) would suggest buyers are absorbing supply and could open a path toward $67,000 (upper weekly range).
- Upside invalidation / resistance behavior: Repeated failures near $65,900–$66,500 may reinforce range trading, favoring mean-reversion back toward weekly value (~$64,000) rather than trend continuation.
- Downside trigger: A sustained move below $65,000 increases risk of rotation into the $63,900–$64,900 high-volume area. This is framed as the next likely “auction” zone where buyers/sellers re-balance.
- Intraday risk markers: The $65,750–$65,800 area is identified as a near-term liquidity node; sharp volatility may pause there before a larger move resumes.
- Range-trade framework: With POCs near $64,000 (weekly) and $65,950 (daily), the market is described as value-driven; strategies may emphasize levels/acceptance over momentum until a clear break from the supply band or loss of $65,000 occurs.
- Macro/cycle sensitivity: The muted post-halving gain suggests monitoring broader liquidity conditions and risk sentiment; catalysts may be needed for a sustained breakout rather than expecting automatic post-halving acceleration.
📘 Glossary
- Heatmap (price “residence”): A visualization of where price spent the most time and/or where trading activity clustered, highlighting areas of heavy participation.
- Point of Control (POC): The price level with the highest traded volume/activity over a chosen period; often treated as a proxy for “fair value” and a key support/resistance reference.
- Value area: The price region where most trading occurred during the period; markets frequently rotate within it during consolidation phases.
- Supply zone / overhead supply: A region where many holders previously acquired coins and may sell into rallies, creating resistance.
- Sell wall: A concentrated pocket of sell orders/liquidity that can slow or stop upward moves until absorbed.
- Support / resistance: Areas where buying (support) or selling (resistance) pressure tends to appear due to positioning, order clusters, or widely watched levels.
- Acceptance / rejection (at a level): Acceptance implies price sustains and trades comfortably beyond a level; rejection implies swift pushback and failure to hold beyond it.
- Drawdown: The percentage decline from a previous peak (e.g., ATH) to the current price.
- Halving: A Bitcoin protocol event that cuts the block subsidy in half, reducing new supply issuance; often monitored for cycle impacts.
- Liquidity: The ease of executing trades without causing large price swings; higher liquidity typically supports smoother price discovery.




















Comment 0