 News
News  Coin Information
  About us
  Customer Service


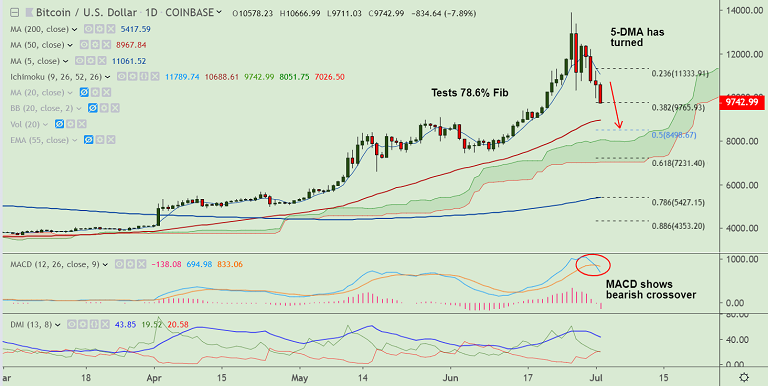
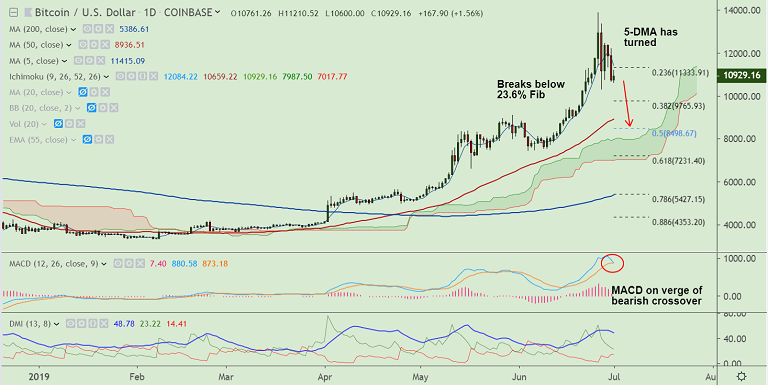
BTC/USD chart - Trading View
Exchange - Coinbase
Support: 8872 (55-EMA); Resistance: 10298 (21-EMA)
Technical Analysis: Bias Bearish
BTC/USD extends weakness below $10,000 mark, hits new 2-week lows at 9733.
Technical indicators support weakness. Stochs and RSI are sharply lower.
MACD is now showing a bearish crossover on signal line. GMMA indicators shows shift in trend towards downside on the intraday charts.
'Bearish divergence' on the daily charts and a confirmed 'Death Cross' on the hourlies adds to the bearish bias.
Further, 'Shooting Star' pattern form on the previous week's candle is likely to drag prices lower.
The pair has broken below 38.2% Fib and we see scope for test of 55-EMA at 8872.
For details on FxWirePro's Currency Strength Index, visit http://www.fxwirepro.com/currencyindex.


Comment 0