 News
News  Coin Information
  About us
  Customer Service


Solana (SOL) is locked in a tense battle around the $87 level, a zone many traders view as the market’s near-term ‘line in the sand’ after the token failed to break above resistance near $96. The standoff matters because price action around this area is likely to determine whether SOL stabilizes into a tradable range or slips into a deeper corrective phase.
As of Friday U.S. Eastern Time (ET), CoinMarketCap data showed SOL trading at $86.81, down 3.36% over the past 24 hours and 6.96% over the last seven days. Daily trading volume came in near $3.2 billion, while Solana’s market capitalization stood at roughly $50.1 billion, keeping it ranked seventh among cryptocurrencies by market value.
Support bands tighten as technical levels converge
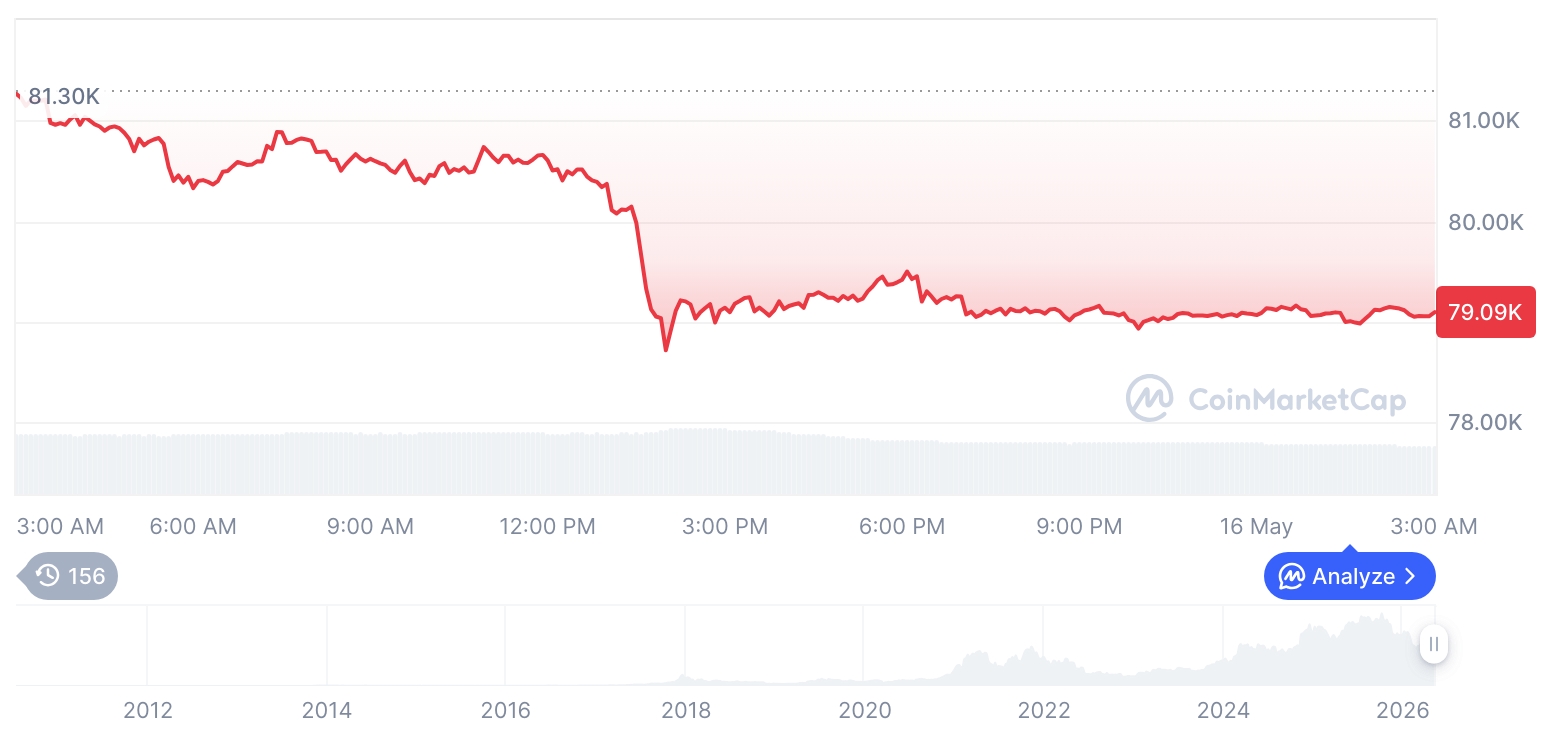
Multiple technical notes circulating in the market have identified $87.5 and $84.7 as immediate support markers. MCO Global highlighted $81.30 as a critical threshold for preserving the token’s medium-term bullish structure, warning that a decisive breakdown could expose SOL to a decline toward the $72–$78 zone.
CaptainAltcoin’s daily outlook described SOL as being “trapped near a major breakdown point,” focusing on the tug-of-war between support around $87 and resistance near $97. Momentum indicators also reflect stress: the relative strength index (RSI) was cited around 34.5, consistent with lingering bearish momentum on shorter timeframes.
From a trader positioning perspective, market watchers commonly view a reclaim of $90 as an early signal that buyers are regaining control, with $92 framed as the more meaningful trigger. A clear break above $92 could reopen a path toward the weekly resistance area around $97. Conversely, failure to defend $87 would likely tilt sentiment toward a broader risk-off move and a potential retest of lower supports.
Long liquidations eased pressure, but direction remains unresolved
SOL’s sharp dip into the $88–$89 area recently wiped out a significant portion of high-leverage long exposure. According to a liquidation heatmap shared by CW, forced selling tied to overextended long positions has largely been flushed out, reducing one source of immediate downside pressure.
However, analysts cautioned that a liquidation reset does not automatically translate into a rebound. Data aggregated by Lines.com from Polymarket indicated the probability of SOL closing the day around the $85 area at roughly 49%, underscoring the lack of consensus on near-term direction even after leverage reportedly normalized.
Spot Solana ETFs show strongest weekly inflows since December
Despite the price pullback, ‘institutional demand’ appears resilient through regulated products. An AMBCrypto report said U.S. spot Solana ETFs recorded approximately $6.5 million in net inflows in the latest session, while weekly net inflows reached about $58 million—described as the strongest weekly intake since December 2025.
On cumulative measures, total net inflows into Solana ETFs were estimated near $1.13 billion, with total assets under management (AUM) around $1.05 billion. Bitwise’s BSOL was cited as the leader with more than $900 million in net inflows, followed by Fidelity’s FSOL and Grayscale’s GSOL. Market participants interpret the figures as evidence of sustained demand for Solana exposure via regulated vehicles, even as spot price action weakens.
Corporate treasury risk emerges around concentrated SOL holdings
Alongside ETF flows, attention is also turning to balance-sheet risk among listed companies with large Solana positions. AMBCrypto identified Forward Industries as the largest publicly traded corporate treasury holder of SOL, reportedly holding about 7 million tokens, most of which are staked.
The concern is cost basis: the company is said to have accumulated SOL at prices well above current levels. At today’s price, Forward Industries is estimated to be sitting on unrealized losses of roughly 1 trillion won (about $730 million at recent exchange rates). In a recent quarterly report, the company posted a net loss of about $586 million, which the report attributed largely to fair-value declines in its Solana holdings.
While such corporate accounting dynamics do not change Solana’s technology or development roadmap, they can become a market factor if a treasury holder is pressured to reduce exposure. Forced sales to manage risk could translate into additional sell-side liquidity and weigh on sentiment—an example of the volatility risks tied to highly concentrated single-asset treasury strategies.
Key levels: short-term range vs. medium-term structure
For now, traders are watching the $87–$92 band as the main decision zone. A clean break above $92 could revive an advance toward $97, while a loss of $87 would increase the odds of a test of $81.30—the level several analysts describe as pivotal for maintaining the medium-term uptrend structure. If $81.30 fails, the market could begin to price in a deeper retracement toward $72–$78.
MCO Global said an aggressive immediate bullish scenario has become less likely in the short run, but maintained that if SOL holds above $81.30, a larger diagonal bullish formation could still remain in play. In the absence of fresh protocol-level catalysts in the near term, market focus appears concentrated on ‘price structure’ and ‘liquidity inflow’ signals—namely whether $87 holds and whether buyers can reclaim $92 and beyond.
🔎 Market Interpretation
- Primary battleground: SOL is compressing around $87, viewed as a near-term “line in the sand” after failing near $96. Price behavior here likely decides range stabilization vs deeper correction.
- Current tape: SOL trades near $86.81 (24h: -3.36%, 7d: -6.96%), with ~$3.2B daily volume and ~$50.1B market cap (ranked #7).
- Technical compression: Support references cluster at $87.5 and $84.7, while medium-term structure is framed around $81.30. A break below that level raises downside risk toward $72–$78.
- Momentum tone: RSI cited around 34.5 suggests bearish/oversold-leaning conditions on shorter timeframes, reinforcing the importance of nearby supports.
- Leverage reset, not resolution: Prior dips into $88–$89 flushed leveraged longs (reduced forced-sell pressure), but consensus remains weak—Polymarket odds cited ~49% for a close around $85.
- Demand divergence: Despite spot weakness, U.S. spot Solana ETFs show strong inflows (weekly ~$58M, best since Dec 2025), implying regulated-channel demand may be accumulating while price consolidates.
- New overhang risk: Corporate treasuries with concentrated SOL exposure (e.g., Forward Industries) introduce potential forced-selling risk if losses/mark-to-market pressures intensify.
💡 Strategic Points
- Decision zone to monitor: $87–$92 is the near-term control range.
- Bullish re-claim sequence: First improve tone above $90; stronger confirmation above $92, which could reopen a move toward $97.
- Bearish breakdown path: Losing $87 increases probability of testing $84.7 and then $81.30; failure at $81.30 risks a deeper retracement toward $72–$78.
- Risk framing with levels:
- Short-term invalidation: For bulls, repeated closes below $87 weaken the “range” thesis.
- Medium-term structure level: $81.30 is treated as pivotal for maintaining a broader bullish structure; a decisive break shifts the market regime to corrective.
- Flow-based insight: ETF inflows (~$6.5M latest session; cumulative inflows ~$1.13B; AUM ~$1.05B) suggest institutional/regulated accumulation may be cushioning declines, but not necessarily reversing trend without price confirmation.
- Positioning takeaway: The long-liquidation “flush” reduces one immediate downside accelerant, yet direction remains unresolved until spot reclaims key resistance or breaks key support.
- Event risk watch: Concentrated corporate holdings increase the chance of non-technical selling (accounting losses, risk management, liquidity needs), which can amplify volatility during weak price structure.
📘 Glossary
- Support / Resistance: Price zones where buying (support) or selling (resistance) historically strengthens, often shaping range boundaries.
- RSI (Relative Strength Index): Momentum indicator (0–100). Readings near/below ~30 are often tagged “oversold,” while near/above ~70 are “overbought.” The article cites ~34.5, indicating weak momentum.
- Liquidation: Forced position closure (commonly in leveraged derivatives) when margin falls below requirements—can accelerate price moves due to market orders.
- Liquidation heatmap: Visualization estimating where large liquidation clusters may sit, implying potential volatility zones if price reaches them.
- Spot ETF: Exchange-traded fund designed to hold the underlying asset (or direct exposure to it). Flows can reflect regulated demand independent of crypto exchange activity.
- Net inflows / AUM: Net inflows measure new money entering a fund; AUM (assets under management) is the total value managed by the fund.
- Staking: Locking tokens to participate in network security/validation in return for rewards; can reduce immediately liquid supply but does not remove price risk.
- Cost basis / Unrealized loss: Cost basis is the average purchase price. Unrealized loss is the paper loss when current price is below cost basis (not realized unless sold).
- Fair-value decline: Accounting adjustment that reduces the reported value of an asset held on a balance sheet when market prices fall.


Comment 0