 News
News  Coin Information
  About us
  Customer Service


Ethereum (ETH) and Solana (SOL) options traders continued to lean bullish into Friday, while XRP (XRP) derivatives showed a more defensive tilt as investors paid up for downside protection. The split highlights how altcoin positioning is becoming increasingly idiosyncratic, with traders differentiating between relative strength bets and near-term volatility hedges.
Data from Deribit, the largest crypto options exchange, showed that options expiring on May 15 carried open interest of 274,091 contracts for Ethereum (about $627.26 million), 18,652 contracts for Solana (about $17.20 million), and 1,736 contracts for XRP (about $2.59 million). Open interest reflects the total number of outstanding contracts that remain active.
By open interest, Ethereum’s put/call ratio stood at 0.39, signaling a strong preference for ‘call options’—contracts that benefit from upside moves. Solana’s put/call ratio came in at 1.02, indicating a near-even split between calls and ‘put options,’ often interpreted as more neutral or wait-and-see positioning. XRP posted a higher put/call ratio of 1.14, suggesting traders were relatively more focused on hedging against declines.
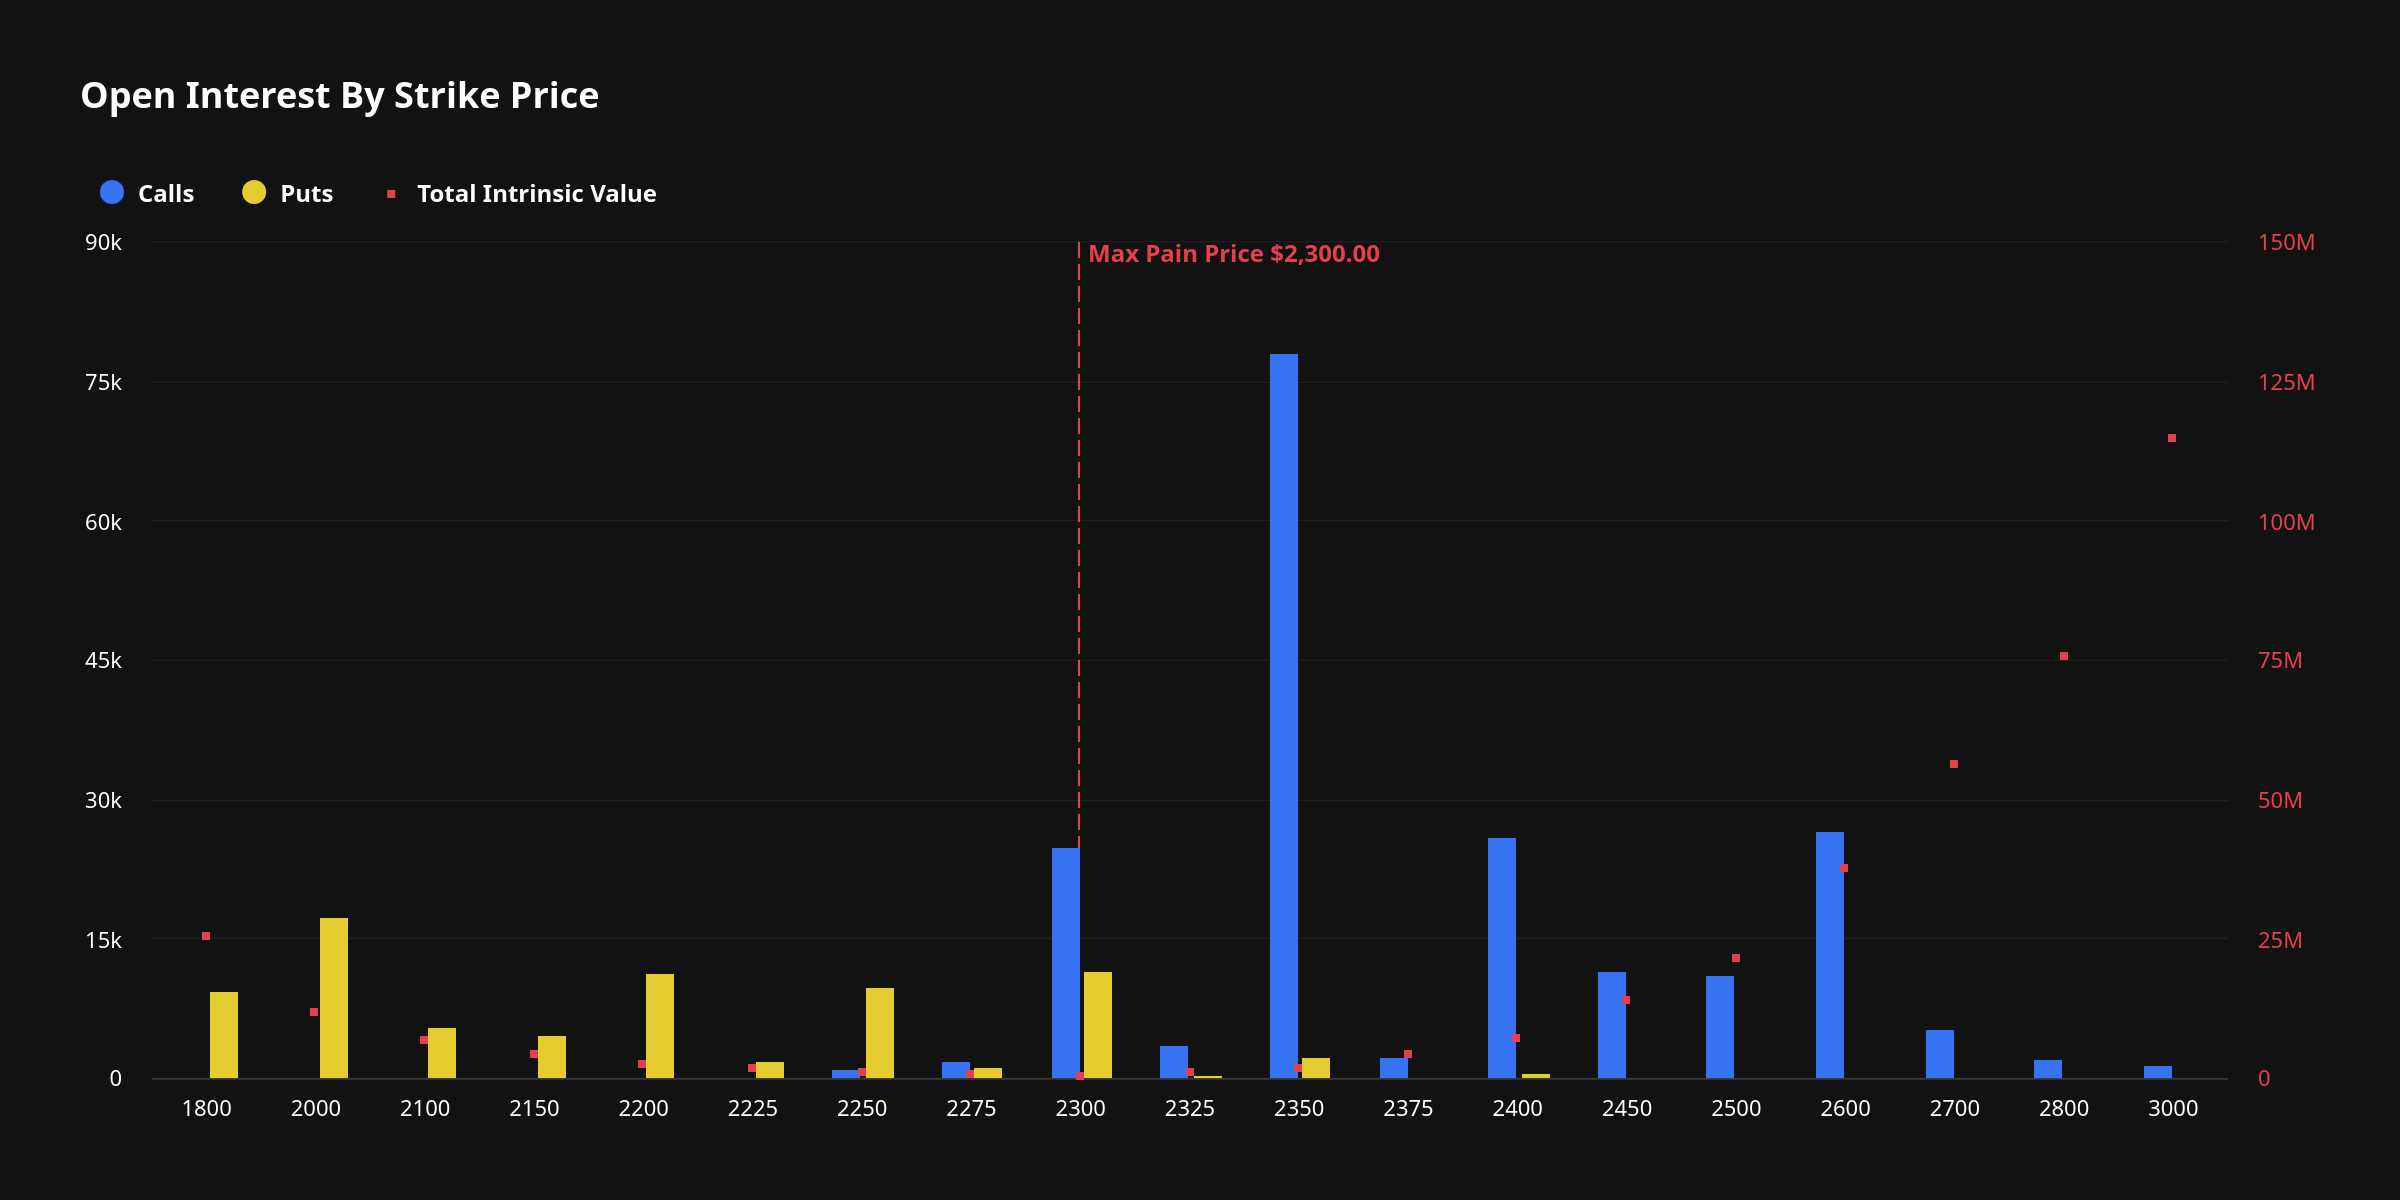
Deribit’s ‘max pain price’—the level at which option buyers collectively incur the most losses at expiration—was estimated at $2,300 for Ethereum, $86 for Solana, and $1.46 for XRP. While max pain is not a forecast, it is widely tracked as a positioning reference point that can influence pinning dynamics near settlement.
Strike-level open interest offered a clearer picture of where traders have concentrated their bets. Ethereum’s largest open-interest clusters were in calls around $2,350, $2,400, and $2,600, indicating that bullish exposure is stacked above spot with particular attention on a move toward the mid-$2,000s. For Solana, call strikes around $94 to $100 ranked among the most popular, while the $86 put also stood out—suggesting investors were pairing upside participation with a defined downside floor. In XRP, call strikes around $1.48 to $1.60 dominated, but the $1.46 put also ranked near the top, reinforcing the impression that traders are bracing for sharp swings even as some position for rebounds.
Short-term flow, however, told a more nuanced story. Over the past 24 hours, Deribit recorded options volume of 124,368 contracts for Ethereum, 67,440 contracts for Solana, and 2,619,000 contracts for XRP. The 24-hour put/call ratios were 1.17 for Ethereum, 0.42 for Solana, and 0.76 for XRP—implying that while Ethereum’s open interest remains call-heavy, recent trading activity skewed toward puts, a pattern consistent with near-term hedging or tactical downside bets. Solana’s volume was decisively call-led, consistent with expectations of a bounce or continuation higher, while XRP’s flow remained call-favored despite elevated volatility and the earlier defensive tilt in open interest.
The most actively traded contracts underscored those themes. In Ethereum, heavy volume rotated through downside strikes such as the $2,100 puts (including expiries on May 29 and June 26), alongside shorter-dated calls around $2,300 and $2,350 expiring May 15. Solana’s top volume was concentrated in a series of $93–$94 calls spanning May 15–16 and May 22. XRP’s busiest contracts clustered around calls at $1.52–$1.54 (May 22) and a $1.60 call (June 26), with notable put activity at $1.50 (May 29) and $1.48 (May 16).
Spot prices in the late Asian morning reflected the divergence. At 1:40 a.m. ET on May 15 (10:40 a.m. in Seoul), Ethereum traded at $2,289, up 1.03% on the day, while Solana fell 1.24% to $92.34 and XRP slid 4.49% to $1.494, according to TokenPost Market.
The broader takeaway is that options traders are not uniformly chasing upside across large-cap altcoins. Ethereum positioning suggests sustained interest in upside exposure but growing attention to protective hedges in the near term. Solana’s tape remains more straightforwardly constructive, with call demand dominating recent activity. XRP stands out for the combination of large turnover and persistent hedging demand—an options-market mix that typically signals heightened uncertainty and sensitivity to sudden price shocks.
🔎 Market Interpretation
- ETH positioning remains structurally bullish but tactically cautious: Open interest is call-heavy (put/call 0.39), yet the last 24h flow flipped to put-heavy (24h put/call 1.17), consistent with traders adding short-term downside hedges while keeping upside exposure.
- SOL reads as the cleanest “risk-on” tape: Open interest is near-neutral (put/call 1.02), but recent volume is strongly call-led (24h put/call 0.42), suggesting active dip-buying/bounce positioning.
- XRP shows the highest uncertainty signal: Higher open-interest put bias (put/call 1.14) alongside call-favored recent flow (24h put/call 0.76) and very large turnover implies two-sided positioning—participants want upside participation but are paying for protection against sharp drops.
- Key “pinning” references into expiry: Deribit max pain levels sit at $2,300 (ETH), $86 (SOL), and $1.46 (XRP). These are positioning magnets rather than forecasts, but they can matter near settlement if flows intensify.
- Spot confirms divergence: ETH was modestly higher (~$2,289), while SOL (~$92.34) and XRP (~$1.494) were lower, aligning with the relatively more defensive stance seen in XRP and the hedging activity appearing in ETH.
💡 Strategic Points
- ETH: Watch the “upside wall” vs. hedge zone: Concentrated call OI at $2,350/$2,400/$2,600 suggests markets are still targeting mid-$2,000s, but heavy trading in $2,100 puts signals hedging for drawdowns. A practical read is “bullish core, hedged front-end.”
- SOL: Defined risk posture via paired strikes: Popular calls in the $94–$100 area and notable interest in the $86 put resemble a “participate up / insure down” structure. Traders may be framing $86 as a near-term floor while leaning into a rebound above the low-$90s.
- XRP: Expect volatility clustering: Calls concentrated at $1.48–$1.60 with a frequently referenced $1.46 put plus meaningful put activity around $1.48–$1.50 suggests the market is braced for sharp swings around the mid-$1.40s to mid-$1.50s range.
- Interpreting OI vs. volume:
- Open interest describes existing positioning (what’s “stuck on the books”).
- 24h volume shows fresh demand (what traders are “doing now”).
- The mismatch in ETH (call-heavy OI, put-heavy volume) is a classic sign of short-dated hedging rather than a full shift to bearish views.
- Expiry dynamics to monitor: With May 15 expiry in focus, price action may gravitate toward max pain levels (ETH $2,300, SOL $86, XRP $1.46) if dealer hedging and closing flows intensify, potentially creating short-lived “pinning” moves.
📘 Glossary
- Options Open Interest (OI): The number of outstanding option contracts that remain active (not closed or expired). Higher OI at a strike can indicate more positioning interest.
- Call Option: A contract that generally gains value if the underlying price rises; often used for bullish exposure.
- Put Option: A contract that generally gains value if the underlying price falls; often used for hedging or bearish exposure.
- Put/Call Ratio: Puts divided by calls. Below 1 often implies more bullish call demand; above 1 often implies more defensive/hedging demand (context matters by coin and expiry).
- Strike Price: The price level at which an option can be exercised; “strike-level OI” shows where traders concentrate bets.
- Max Pain Price: The price level where option buyers collectively lose the most at expiration (based on OI). It is a positioning reference, not a directional prediction.
- Pinning Dynamics: Price gravitating toward a strike or level into expiration due to hedging/position adjustments by large participants.
- Downside Protection / Hedge: Using puts (or put spreads) to reduce losses if the underlying falls, commonly purchased during uncertain or volatile periods.


Comment 0