 News
News  Coin Information
  About us
  Customer Service


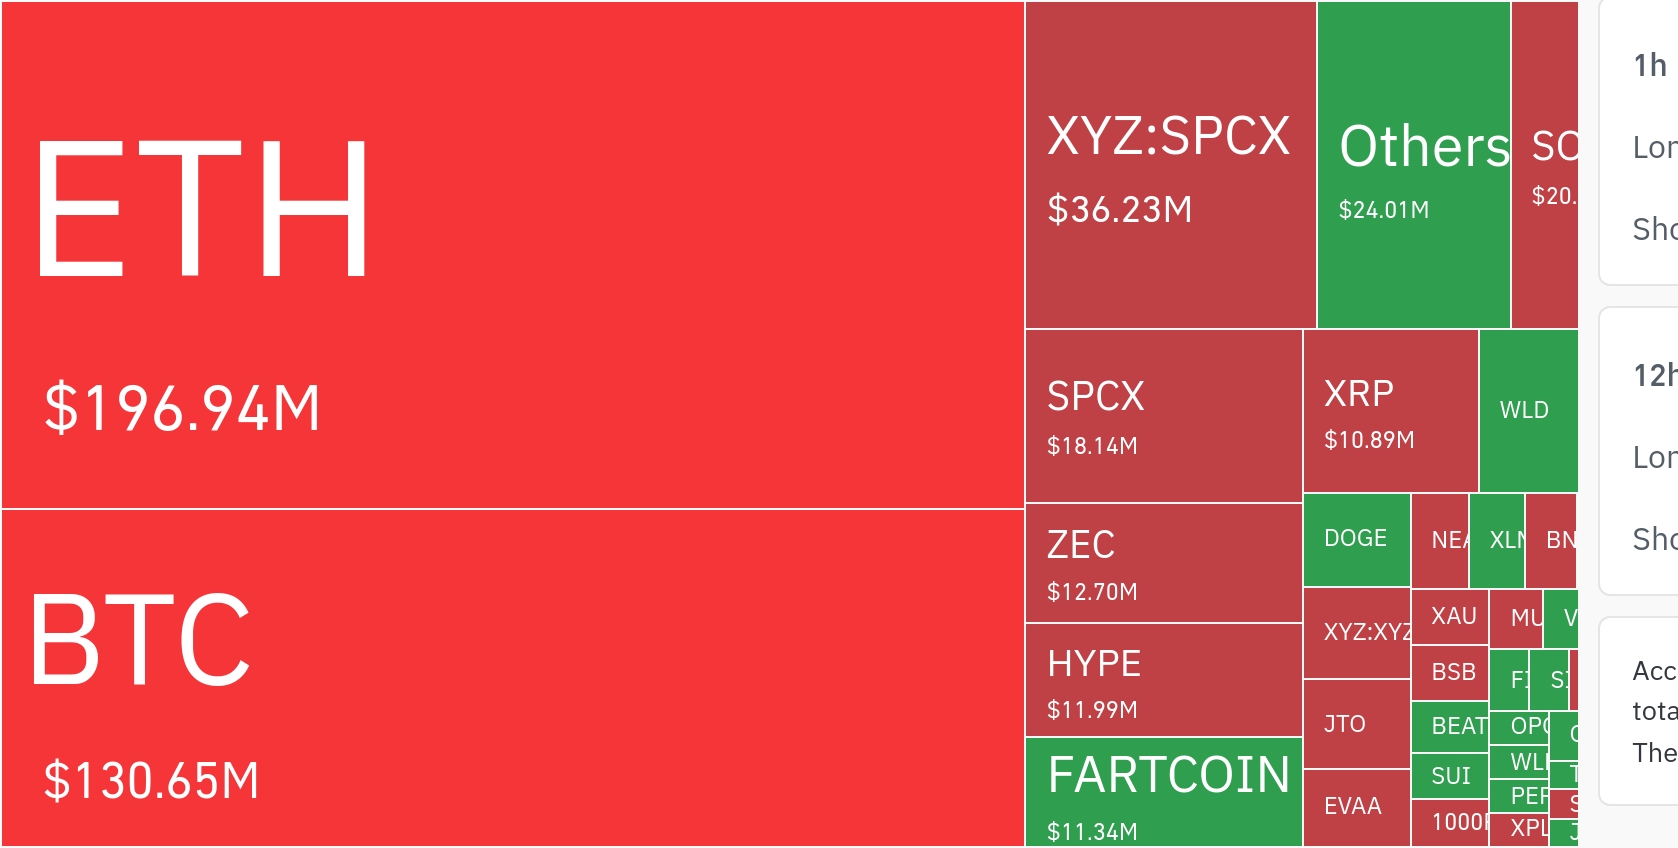
Bitcoin (BTC) is settling into a new trading range after failing to hold recent highs near $67,000, with market participants increasingly focused on a dense ‘sell wall’ around $65,800 and emerging support in the mid-$64,000s. The shift suggests short-term equilibrium rather than a clear directional breakout, as liquidity concentrates between well-defined resistance overhead and a growing base of bids below.
According to data from BitcoinCounterFlow’s price-volume heatmap taken on Wednesday, June 18 (UTC), the strongest weekly ‘point of control’ (POC)—the price zone with the highest concentration of traded volume—sits between $64,800 and $65,200. BTC was trading near that area, indicating that the market’s most accepted price over the past week has clustered in the mid-$65,000 range.
Overhead, the weekly heatmap shows the thickest band of historical trading activity between $65,600 and $66,000, with a particularly heavy accumulation around $65,800. Analysts typically interpret such zones as potential resistance, as traders who previously transacted there may look to exit on rallies, adding supply when price returns. If BTC attempts a rebound, the $65,800 level is likely to function as a key ‘overhang’ that must be absorbed before momentum can build.
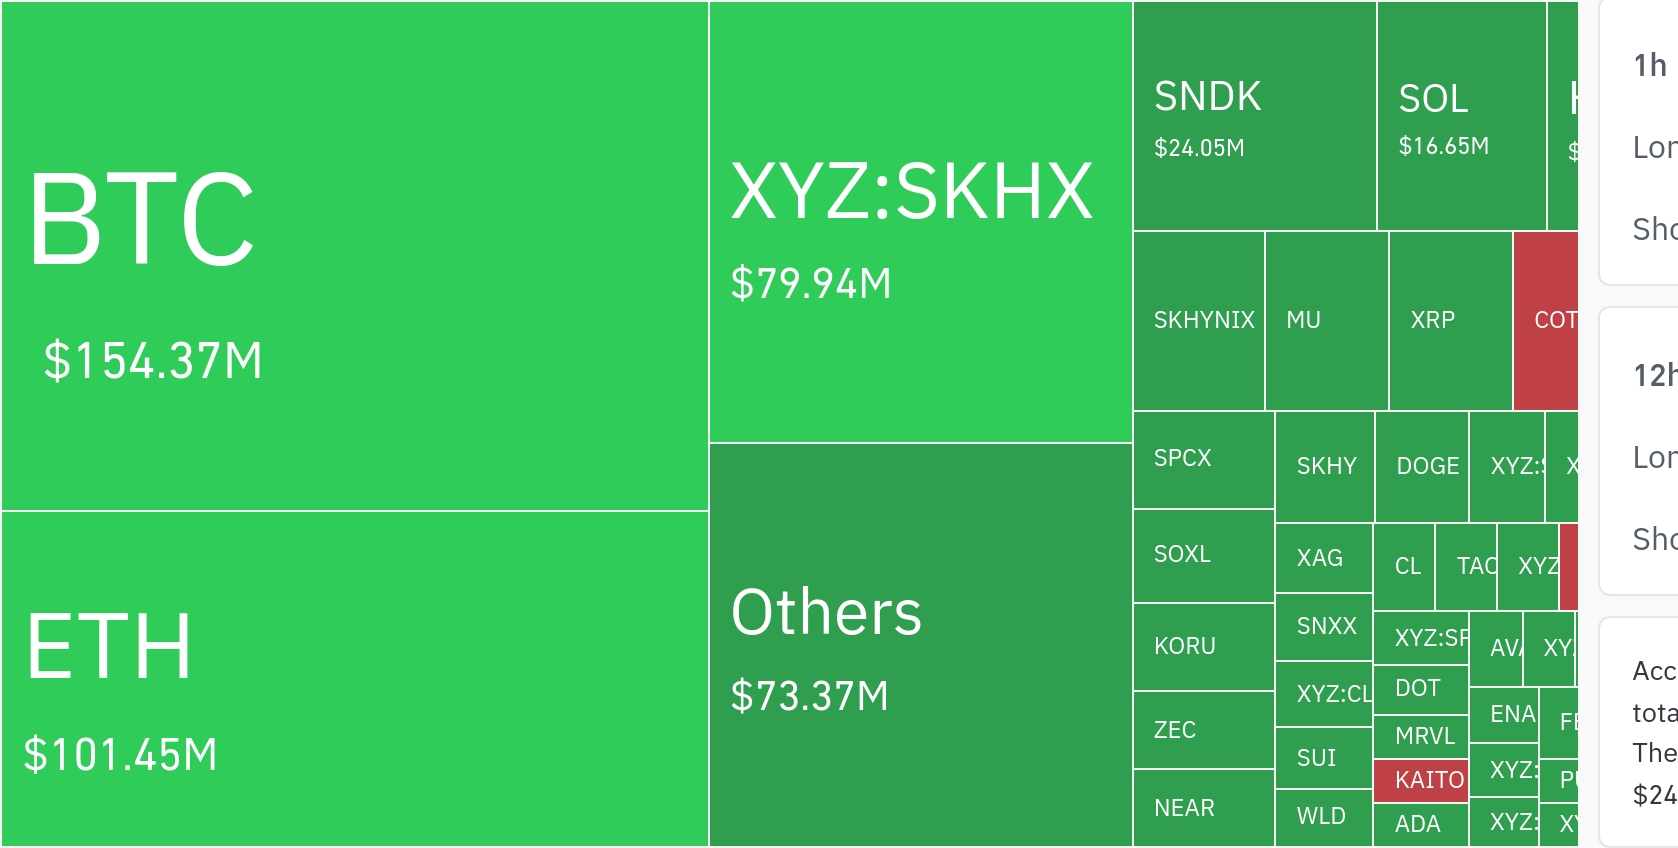
On the downside, volume concentration is rising between $63,800 and $64,300, suggesting a newly forming support region. From a market-structure perspective, repeated trading and acceptance in this band can help establish a floor, especially if spot buying continues to defend pullbacks into the low-to-mid $64,000s.
Shorter-term signals are broadly consistent. In the 24-hour heatmap, the strongest POC is located around $65,700 to $65,900, while BTC has been trading below that zone—implying near-term supply remains active overhead. The primary resistance band in the intraday view is identified between $65,700 and $66,000, while the $64,000 to $64,300 area is again highlighted as a near-term support pocket where volume has been clustering.
With those levels in place, the market appears to be searching for balance between ‘support defense’ around $64,000 and ‘supply pressure’ approaching $66,000. Absent a decisive catalyst, this kind of two-sided trade often translates into range-bound conditions, with volatility driven by liquidity grabs around the edges rather than sustained trend formation.
BTC was last recorded near $64,599, down roughly 48.75% from its cycle peak of $126,038. While that drawdown has narrowed from about 51.09% the prior week—signaling some easing in immediate downside pressure—price remains near half of the peak level, keeping the broader tone skewed toward a corrective phase rather than a renewed uptrend.
From a cycle perspective, the report notes that roughly 790 days have passed since the fourth Bitcoin halving on April 20, 2024. BTC is up about 1.17% versus its halving-day price near $63,850, leaving post-halving performance marginally positive but notably restrained. Historically, prior cycles have often featured extended consolidation following halving events before stronger upside traction emerged later, and the current market is still struggling to establish a decisive narrative.
Longer-term comparisons remain more constructive. Since the cycle low near $15,770 on Nov. 21, 2022—about 1,306 days ago—Bitcoin is still up roughly 310%, underscoring that despite the sharp retracement from peak levels, the broader recovery from the 2022 bottom remains intact.
The cycle framework cited in the data also points to Oct. 21, 2026 as a potential window for an ‘end-of-bull’ phase based on historical patterns, with roughly 125 days remaining in that model’s projected timeline. While such estimates are inherently uncertain, traders and institutional desks often watch late-cycle periods closely, as price action in the coming months could determine whether BTC reclaims key overhead liquidity—or confirms a longer consolidation below the $66,000 area.
🔎 Market Interpretation
{"range_state":"BTC is consolidating after rejecting near $67,000, with liquidity compressing between mid-$64,000 support and ~$66,000 resistance.","key_volume_node_weekly":{"POC":"$64,800–$65,200","meaning":"Highest accepted/traded price area for the week; price gravitating here suggests equilibrium."},"overhead_supply":{"sell_wall_core":"~$65,800","resistance_band":"$65,600–$66,000","implication":"Prior heavy trading may turn into supply as traders sell into rallies; upside needs absorption of this overhang."},"downside_demand":{"support_band":"$63,800–$64,300","implication":"Rising volume and repeat acceptance can form a floor if spot buyers defend dips."},"intraday_alignment":{"POC_24h":"$65,700–$65,900","status":"BTC trading below this node indicates near-term supply overhead remains active.","intraday_levels":{"resistance":"$65,700–$66,000","support":"$64,000–$64,300"}},"price_context":{"last_price":"~$64,599","cycle_drawdown":"~48.75% below peak $126,038","tone":"Still corrective despite a small improvement in drawdown vs last week."}}
💡 Strategic Points
{"trade_map_levels":{"support_1":"$64,000–$64,300 (first defense zone)","support_2":"$63,800–$64,000 (deeper support acceptance)","pivot":"$64,800–$65,200 (weekly POC / fair value region)","resistance_1":"$65,600–$66,000 (supply band)","key_gate":"~$65,800 (sell-wall / overhang to absorb)","failed_high_area":"~$67,000 (recent rejection reference)"},"likely_regime":{"base_case":"Range-bound trade unless a catalyst emerges.","how_volatility_forms":"Liquidity grabs and stop-runs near range edges rather than trend continuation."},"bullish_invalidation_of_range":{"signal":"Sustained acceptance above ~$66,000 and absorption of ~$65,800 supply","what_to_watch":"Volume building above the prior resistance band and POC shifting upward."},"bearish_risk_case":{"signal":"Loss of acceptance below $63,800–$64,000","what_to_watch":"Volume migrating lower and bids thinning in the $64,000 pocket."},"cycle_notes":{"post_halving_status":{"days_since_halving":"~790 days since Apr 20, 2024","performance_vs_halving":"~+1.17% vs ~$63,850","read":"Underwhelming post-halving follow-through so far; consolidation consistent with some historical cycles."},"macro_uptrend_still_intact":{"since_2022_low":"~+310% since $15,770 (Nov 21, 2022)","interpretation":"Despite peak-to-now retracement, the multi-year recovery remains intact."},"model_based_timing_risk":{"reference_window":"Oct 21, 2026 cited as potential end-of-bull window (model-based)","caveat":"Time-cycle projections are uncertain; use as a context marker, not a trigger."}}
📘 Glossary
{"POC_point_of_control":"The price level/zone with the highest traded volume in the selected period; often treated as a ‘fair value’ area.","Price-Volume_Heatmap":"A chart showing where volume occurred across price levels; thicker/brighter areas indicate heavier trading activity.","Sell_Wall":"A large concentration of sell orders (or effective supply) near a price level that can cap rallies.","Resistance":"A zone where selling pressure historically appears, potentially stopping or slowing price advances.","Support":"A zone where buying interest historically appears, potentially stopping or slowing declines.","Liquidity_Concentration":"When orders/volume cluster at specific prices, often creating magnets for price movement.","Acceptance":"Repeated trading and holding within a price zone, implying the market is comfortable transacting there.","Overhang":"Supply from prior participants at a level who may sell when price revisits, creating resistance.","Range-Bound_Conditions":"Price oscillates between support and resistance without a sustained trend; breakouts often fail until a catalyst shifts order flow.","Halving":"A programmed Bitcoin event that halves block rewards; historically influences supply dynamics and market cycles."}


Comment 0