

 News
News  Coin Information
  About us
  Customer Service


 Add as a preferred source on Google
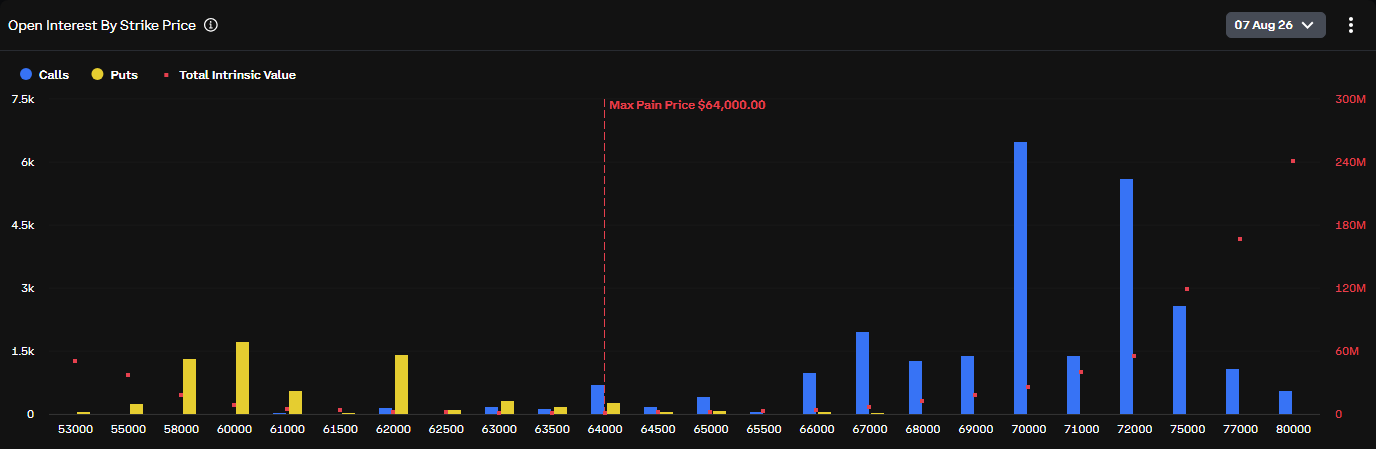
Bitcoin (BTC) options positioning continued to signal a broadly bullish bias, with call contracts dominating open interest even as spot prices hovered near a key options-derived level around $64,000. The skew matters because derivatives positioning on Deribit—one of the largest crypto options venues—often serves as a real-time proxy for how traders are pricing upside versus downside risk into near-term expiries.
As of Aug. 7 at 2:30 a.m. ET (6:30 a.m. UTC), Deribit data showed total open interest in Bitcoin options expiring that day at 32,044 contracts, representing roughly $2.0639 billion in notional value. Calls accounted for 25,410 contracts versus 6,634 puts, putting the put/call ratio at 0.26—a level typically interpreted as firmly in the ‘bullish’ zone, reflecting stronger demand for upside exposure than downside protection.
Despite the call-heavy open interest, the market’s ‘max pain’ level—often watched as the strike price at which option buyers collectively lose the most at expiry—was estimated at $64,000. Bitcoin was trading around $64,332 at the same timestamp, down 0.27% from the prior day, according to TokenPost Market data. The proximity to max pain can become a focal point into expiry as hedging flows and dealer positioning may influence intraday price behavior, though it does not determine direction on its own.
Strike-level positioning suggested traders were still paying for upside optionality. The largest concentration of open interest was stacked at the $70,000 call strike in the near-dated complex, indicating that $70,000 remains a prominent ‘target’ level in current market expectations. Additional sizeable call open interest was also observed at $72,000 and $75,000, implying that a segment of the market is positioning for a continuation of the rally rather than merely a range-bound outcome.
Across all expiries, the $70,000 call again led open interest, reinforcing its role as the market’s primary upside reference point. On the downside, notable put open interest at the $60,000 strike pointed to demand for hedges or downside structures, while a large build at the $80,000 call strike suggested longer-dated upside bets remain in play—highlighting the typical coexistence of ‘upside participation’ and ‘tail-risk hedging’ within the same options book.
Flow data over the most recent 24 hours showed a more balanced picture than open interest alone. Put volume totaled 5,535.6 contracts versus call volume of 6,020.7 contracts, leaving the 24-hour put/call ratio at 0.92. While still tilted toward calls, the relatively narrow gap suggested traders continued to buy protection alongside upside exposure, consistent with a market that expects higher prices but remains mindful of volatility and drawdown risk.
The most actively traded contracts over the past day included a $96,000 call expiring Dec. 25, a $63,000 put expiring Aug. 10, a $67,000 call expiring Aug. 10, an $80,000 call expiring Dec. 25, and a $45,000 put expiring Sept. 25. Concentrations of open interest were strongest around the Sept. 25 and Dec. 25 expiries, both showing roughly 65% call dominance, while Aug. 28 also leaned call-heavy at about 61%.
In volume terms, Aug. 28 led activity with puts comprising about 56% of trading for that expiry, hinting at short-dated hedging demand even as longer-dated flows remained more decisively call-skewed—Dec. 25 volume was about 80% calls. Taken together, the data painted a market still oriented toward upside scenarios, but one that is actively pricing ‘downside volatility’ rather than ignoring it.
🔎 Market Interpretation
- Positioning remains structurally bullish: Deribit open interest for the Aug. 7 expiry shows calls (25,410) heavily outweigh puts (6,634), producing a put/call ratio of 0.26, typically read as strong demand for upside exposure.
- Spot is hovering near “max pain” ($64,000): BTC traded near $64,332, close to the estimated max pain level, which can become a magnet point into expiry due to hedging/dealer flows, though it is not a directional guarantee.
- Upside reference level is clearly defined at $70,000: The $70,000 call holds the largest open interest both near-dated and across all expiries, signaling that traders widely view $70K as the primary upside milestone.
- Market is bullish but not complacent: 24-hour flows are far more balanced (put volume 5,535.6 vs call volume 6,020.7; 24h put/call = 0.92), implying traders are adding protection alongside upside bets.
- Term structure shows “calls dominate longer-dated,” hedging shows up short-dated: Longer expiries (notably Dec. 25) skew strongly toward calls, while the Aug. 28 expiry sees relatively heavier put trading (about 56% of volume), consistent with near-term hedging demand.
💡 Strategic Points
- Key levels to monitor into expiry:
- $64,000: max pain / potential pin zone where hedging flows may intensify.
- $60,000: notable put open interest—commonly a hedge strike that can become a focal point if downside momentum increases.
- $70,000: largest call OI—major upside “consensus target” and potential gamma-related battleground if approached.
- $72,000–$75,000: additional call clusters—signals the market is paying for continuation beyond $70K, not only a quick pop.
- $80,000 (and even $96,000) calls in longer dates: reflects tail-upside participation, especially into Dec. 25 expiry.
- Interpret OI vs. volume correctly: Open interest shows the existing positioning stock (structural bias), while volume shows new/active demand. Here, OI is very call-skewed, but recent volume is closer to neutral—suggesting an “upside base case” with active risk management.
- Expiry dynamics risk: With spot near max pain, intraday moves can be influenced by dealer hedging adjustments. Traders should anticipate potentially sharper, more technical price action near settlement windows.
- Practical read-through: The market appears to be pricing higher prices over time (persistent call dominance across expiries) while also pricing near-term volatility/drawdown risk (short-dated put demand rising in volume).
- Scenario framing from positioning:
- Bull continuation: A sustained push toward $70K aligns with the largest call OI; above that, $72K–$75K become secondary magnets.
- Range/pin outcome: Trading around $64K into expiry is consistent with max pain proximity and hedging effects.
- Risk-off move: Increased focus on $60K corresponds with meaningful put positioning and could accelerate hedging demand if breached.
📘 Glossary
- Options Open Interest (OI): The number of outstanding option contracts that remain open (not closed or expired). High OI at a strike indicates heavy positioning there.
- Call Option: A contract that generally benefits from the underlying price rising; gives the right (not obligation) to buy at a set strike price.
- Put Option: A contract that generally benefits from the underlying price falling; gives the right (not obligation) to sell at a set strike price.
- Put/Call Ratio: Puts divided by calls (by OI or by volume). Lower values often imply bullish positioning; higher values imply more demand for downside protection.
- Max Pain: A commonly cited estimate of the strike where option buyers collectively lose the most at expiry (and option sellers lose the least). It can influence attention and positioning but does not predict direction by itself.
- Strike Price: The preset price at which an option can be exercised.
- Expiry (Expiration): The date/time when an option contract ends and settles.
- Notional Value: The approximate dollar value represented by the options exposure (often derived from underlying price and contract size).
- Hedging Flows / Dealer Positioning: Trades made to offset risk (e.g., by market makers), which can amplify or dampen price moves near key strikes and expiries.
- Tail Risk: Low-probability, high-impact outcomes (sharp crash or explosive rally) that options are often used to hedge or express.

















Comment 0