 News
News  Coin Information
  About us
  Customer Service


Ethereum (ETH) is widening its lead over Solana (SOL) in the race for on-chain fee revenue, underscoring a shift in what the market is paying for: not sheer transaction volume, but the settlement of higher-value financial activity tied to Layer 2 scaling and real-world asset (RWA) tokenization.
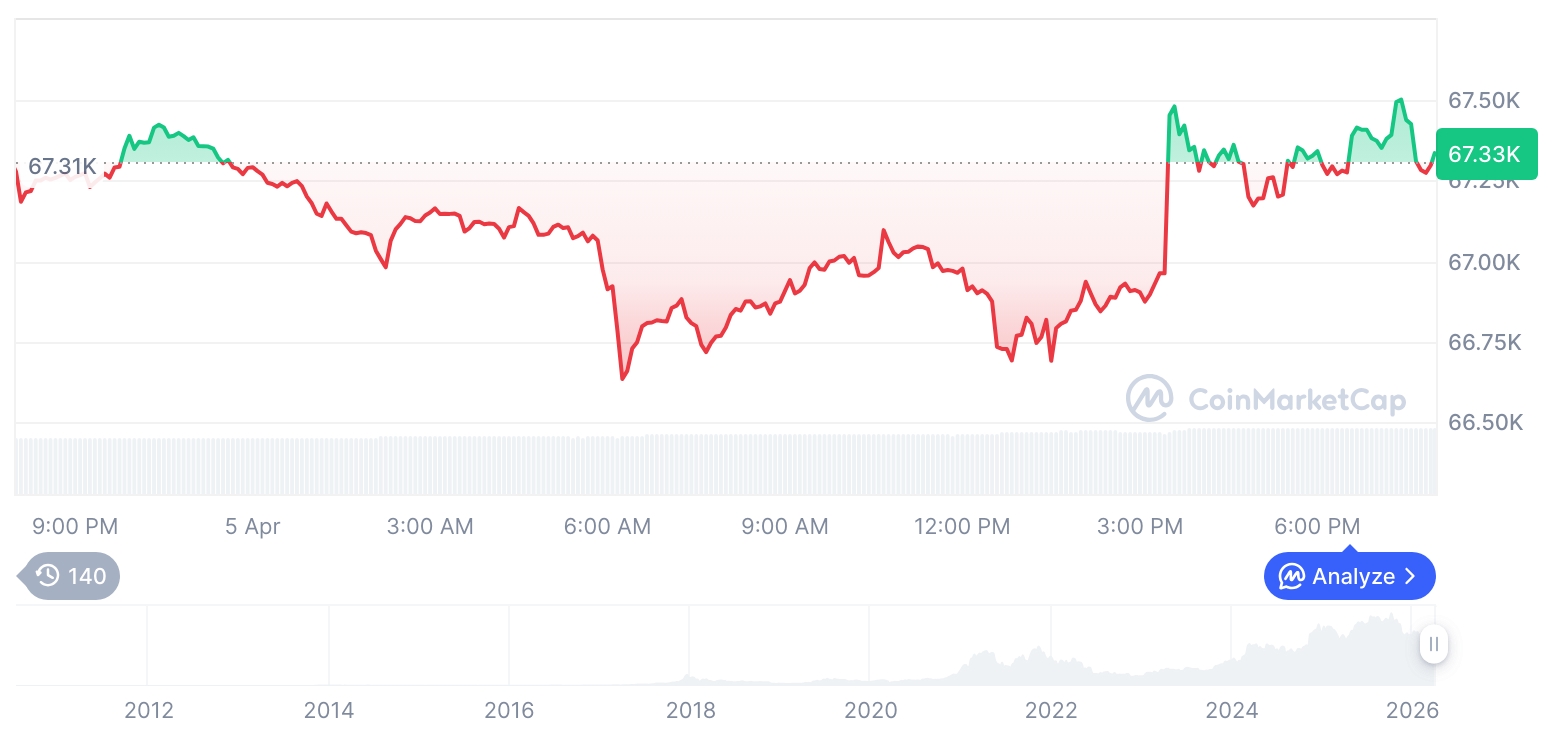
On the latest on-chain data cited in the report, Ethereum generated about $7.15 million in fees over the past 24 hours, up 1.4% from the prior reading. Solana posted roughly $4.06 million over the same window, down 3.5%. The gap becomes more pronounced over longer periods: Ethereum’s seven-day fees totaled about $58.95 million versus Solana’s $39.37 million, while 30-day fees reached approximately $317.68 million compared with Solana’s $180.20 million—around a 1.76x advantage for Ethereum on the monthly measure.
Market watchers increasingly view the divergence as structural rather than cyclical. Ethereum’s scaling stack has pushed the bulk of activity onto Layer 2 networks—where transactions are processed cheaply and in high volume—while still routing final settlement to Ethereum’s base layer. That design concentrates value at the point of L1 finality: batches are posted, proofs are verified, bridges are used, and data availability is paid for. In effect, Ethereum is optimizing for ‘fewer settlement events, more value per settlement event,’ a model that can increase fee capture even if much of the day-to-day user activity occurs off the main chain.
A key accelerant, according to the analysis, is the reinforcing loop between ‘L2 + stablecoins + RWA.’ Circle’s USDC ecosystem is described as a pivotal rail for tokenized finance, particularly for settlement in tokenized U.S. Treasury bills and commodities-linked instruments. As more RWA issuance and secondary activity leans on USDC as a settlement asset, demand rises not only for transactions on L2s but also for the L1 processes that make those transactions final and interoperable—bridging operations, oracle updates, and base-layer settlement. Each of those steps can generate fees that accrue to Ethereum’s economic layer.
That flow can be summarized as a pipeline: expanding RWA issuance drives higher USDC settlement demand, which increases L2 transaction throughput, which in turn raises the frequency and value of L1 settlement events. In this framing, L2s are not merely a cost-reduction tool; they function as a ‘revenue amplifier’ by aggregating activity and monetizing finality at the base layer.
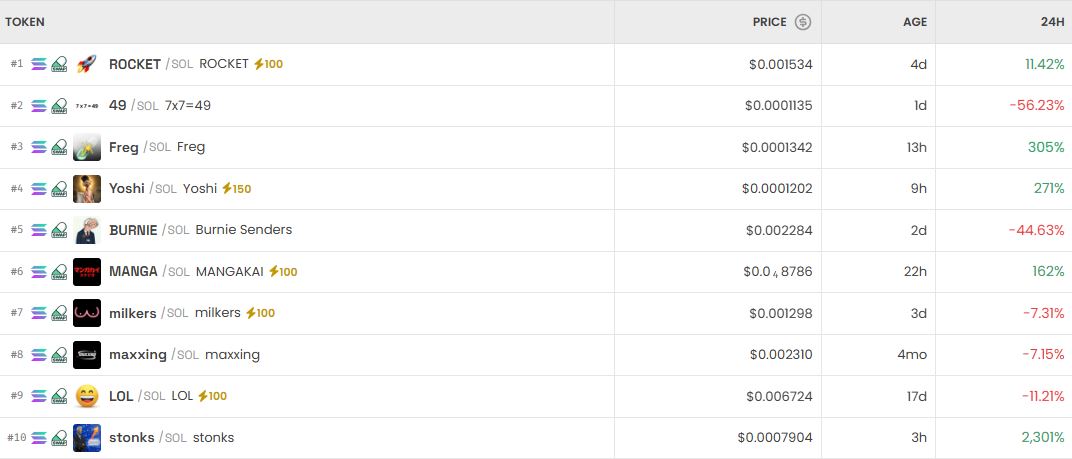
Solana, by contrast, is portrayed as running into a margin problem rather than a performance problem. Its architecture is built for high throughput and low latency, which has made the network a natural venue for memecoin trading, high-frequency activity, and smaller-ticket DeFi transactions. But the same low-fee, high-volume approach can limit fee revenue per unit of activity—exposing a model where rising usage does not translate proportionally into higher on-chain income. In traditional finance terms, the report likens Ethereum’s profile to a higher-margin ‘investment bank’ model—complex, value-dense financial contracts—while Solana resembles a lower-margin ‘payment network’ built on scale.
The time-series data strengthens the case that this is not a one-off dislocation. The fee advantage persists on both the weekly and monthly windows, and the report argues the spread widens as the measuring period extends—consistent with ‘sticky’ capital moving into recurring settlement workflows rather than speculative bursts. Tokenized Treasury markets and institutional-style allocations are highlighted as especially important because they can generate repeatable, more predictable fee streams—often described as ‘real yield’—compared with the episodic revenue spikes seen in NFTs or highly volatile DeFi cycles.
That distinction may also carry valuation implications. If current revenue run rates are annualized, Ethereum sustains a materially larger revenue base than Solana, in the report’s estimates. Because RWA-linked activity tends to be less volatile and more persistent, the analysis suggests the market could apply a different premium to networks that capture that cash-flow-like profile, potentially feeding into a reassessment of valuation frameworks such as price-to-sales (P/S) ratios commonly borrowed from equities analysis.
Ultimately, the report frames the competition as a shift away from headline TPS benchmarks toward ‘where money is actually created and settled.’ Ethereum’s infrastructure is increasingly positioned as a high-value settlement layer for tokenized finance, while Solana remains optimized for fast, low-cost throughput. If tokenized assets and stablecoin-based settlement continue to scale, the battle for dominance may hinge less on raw usage and more on which chain becomes the default home for capital-intensive workflows—and, for now, Ethereum appears to be consolidating that role.
🔎 Market Interpretation
- Fees signal where value settles, not where activity happens: Ethereum is collecting more fee revenue than Solana because it captures monetization at Layer 1 finality (batch posting, proof verification, bridging, and data availability), even as much user activity shifts to L2s.
- Persistent divergence suggests a structural trend: ETH leads SOL in fees across 24h ($7.15M vs $4.06M), 7d ($58.95M vs $39.37M), and 30d ($317.68M vs $180.20M), with the advantage widening over longer windows (~1.76x on 30d), consistent with recurring settlement workflows rather than short-lived speculation.
- “L2 + stablecoins + RWA” is the core demand driver: Growing real-world asset tokenization, especially tokenized Treasuries and commodities-linked instruments, increases stablecoin settlement (notably USDC), which boosts L2 throughput and ultimately increases value-dense L1 settlement events on Ethereum.
- Different business models produce different fee outcomes: Ethereum is framed as a higher-margin, value-dense “investment bank” settlement layer; Solana as a lower-margin “payment network” optimized for speed/scale—great for memecoins and small-ticket DeFi, but with weaker fee capture per unit of activity.
- Valuation implication: If RWA-linked flows are “stickier” and more repeatable, markets may treat Ethereum’s fee base as more cash-flow-like (“real yield”), potentially supporting higher or different valuation multiples (e.g., P/S-style frameworks).
💡 Strategic Points
- Watch settlement metrics, not TPS: Track L1 fee share, blob/data availability payments, bridge volumes, and proof verification activity as leading indicators of ETH’s monetization strength.
- Monitor the RWA settlement pipeline: RWA issuance → USDC settlement demand → L2 transaction growth → increased L1 settlement frequency/value. Growth anywhere in this chain can reinforce Ethereum’s fee advantage.
- Stablecoin rail concentration matters: If USDC continues to be the preferred settlement asset for tokenized finance, Ethereum’s ecosystem may benefit via recurring interoperability and finality costs (bridges/oracles/settlement posting).
- Solana’s upside requires margin expansion, not just volume: For SOL to close the fee gap, it likely needs more value-dense use cases (institutional/RWA settlement, larger DeFi positions, higher willingness-to-pay) or monetization changes that don’t undermine its low-cost thesis.
- Longer-window fee trends are the “signal check”: A widening monthly/quarterly spread implies durable capital workflows; a narrowing spread would suggest either SOL monetization improving or ETH settlement demand cooling.
📘 Glossary
- On-chain fees: Costs paid by users/applications to have transactions processed and finalized on a blockchain network.
- Layer 1 (L1): The base blockchain (e.g., Ethereum mainnet) providing security and final settlement.
- Layer 2 (L2): Scaling networks that execute transactions off L1 and periodically submit batches/proofs to L1 for settlement (often cheaper/faster for users).
- Finality / settlement: The point at which transactions are considered irreversible and economically secured—where “high-value” activity ultimately gets anchored.
- Data availability: Ensuring transaction data is posted or accessible so the network can verify state transitions; can be a meaningful component of L1/L2 fee economics.
- Bridging: Moving assets/data between chains or L2s, typically involving L1 contracts and fees for security and interoperability.
- Oracle updates: On-chain publishing of external data (e.g., prices, rates) used by smart contracts; can generate recurring transaction fees.
- Stablecoins (USDC): Tokens pegged to fiat currency (usually USD) used for settlement and liquidity in crypto markets; USDC is issued by Circle.
- RWA (Real-World Assets): Tokenized representations of off-chain assets such as U.S. Treasury bills or commodities-linked products.
- Real yield: More repeatable, usage-driven protocol revenue (fees) viewed as less speculative than one-off cycles (e.g., NFT booms).
- P/S ratio (Price-to-Sales): Equity-style valuation metric comparing market value to revenue; sometimes applied to crypto networks using fee/protocol revenue as a proxy.


Comment 0