 News
News  Coin Information
  About us
  Customer Service


Global liquidity growth is losing momentum, and the slowdown is colliding with a sharp bout of risk-off sentiment in U.S. crypto ETFs as Bitcoin (BTC) products posted one of their largest single-day outflows in recent weeks.
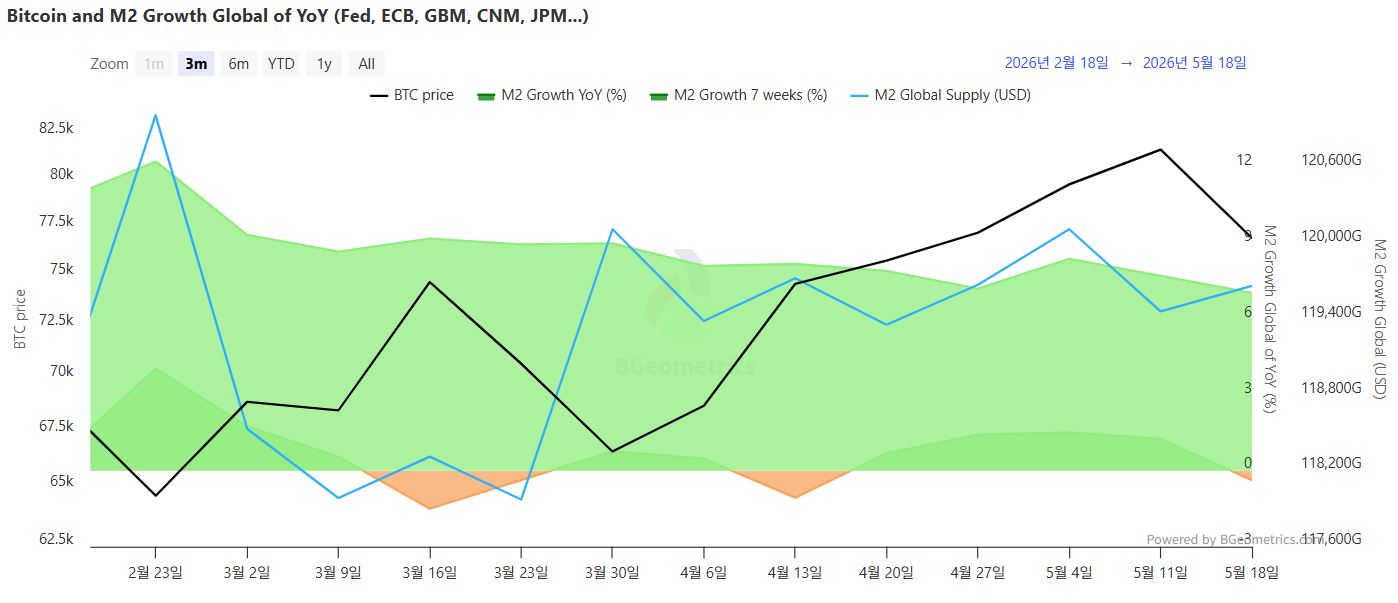
According to data compiled by Bigeometrics, global M2 money supply—a broad measure of cash and near-cash instruments—stood at $119.6114 trillion as of May 18. That marked a modest 0.13% increase from $119.4608 trillion on May 11, but the broader trend showed clear deceleration: the seven-week change rate fell to -0.37%, a steep drop from the prior week’s 1.26% reading. Year-on-year growth also eased to 7.03% from 7.70% the week before, suggesting the pace of liquidity expansion is cooling both in the short term and on an annual basis.
Liquidity metrics matter for crypto because Bitcoin is often treated as a 'liquidity barometer,' with historical patterns showing prices can respond to shifts in broad money growth with a lag of roughly 10 weeks. Still, analysts caution that liquidity alone rarely explains price action in isolation, especially during periods dominated by event-driven flows such as profit-taking, ETF activity, and corporate treasury buying.
On-chain valuation indicators offered a more tempered picture of market heat. Bitcoin’s MVRV Z-Score—a metric comparing market capitalization to realized value to gauge 'overvaluation' or 'undervaluation'—came in at 0.75, down from 0.91 the prior week. The decline implies valuation pressure has eased slightly even after the recent price rebound. At the same time, the reading remains firmly within the 0–2 'neutral' band, indicating the market is not displaying classic overheating signals associated with cycle tops.
Long-term holder behavior also pointed to restrained sell pressure. The 1+ Year HODL Wave, which measures the share of BTC that has not moved for at least a year, rose to 60.59% from 60.22% a week earlier. With more than 60% of supply held in long-dormant wallets, the data suggests continued 'structural supply lock-up'—a dynamic that can amplify price moves when demand rebounds, but can also limit immediate sell-side liquidity during periods of uncertainty.
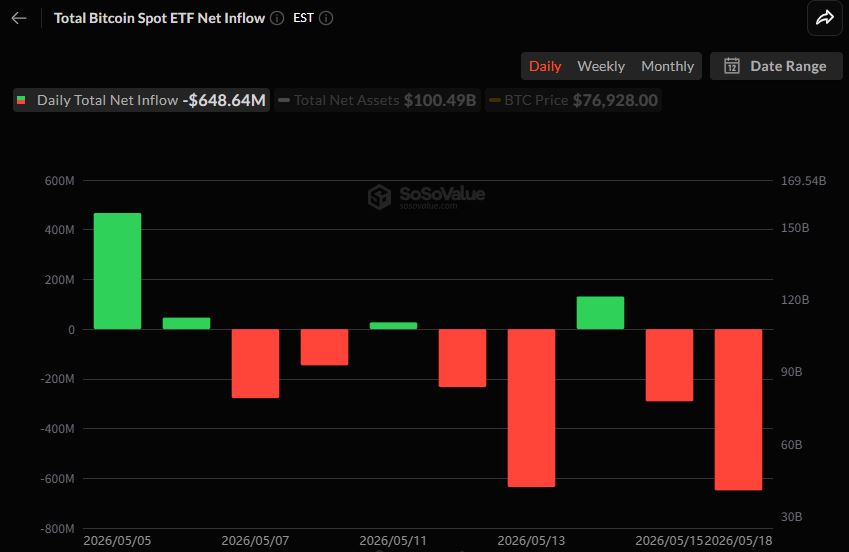
Against that backdrop, ETF flows turned decisively negative. Sosovalue data showed U.S. spot Bitcoin ETFs recorded net outflows for two consecutive sessions, including -$290.42 million on May 15 and -$648.64 million on May 18 (U.S. time). The selling was not confined to Bitcoin: U.S. spot Ethereum (ETH) ETFs extended their losing streak to six straight sessions, with net outflows continuing from May 11 through May 18, including -$86.31 million on May 18.
The combination of slowing global M2 growth and sustained ETF redemptions is likely to be watched closely by investors as a test of broader 'liquidity-driven' narratives in crypto. While on-chain indicators suggest the market is not in an overheated valuation regime, the near-term tone is being set by capital flows—particularly from regulated investment vehicles that can move quickly in response to macro shifts, positioning changes, and perceptions of risk.
🔎 Market Interpretation
- Global liquidity is decelerating: Global M2 reached $119.6114T (May 18), up slightly WoW (+0.13%), but momentum weakened with the 7-week change rate falling to -0.37% (from +1.26%) and YoY growth easing to 7.03% (from 7.70%).
- Macro tailwind for crypto is cooling: Because BTC often trades like a liquidity-sensitive asset, a slowdown in broad money growth can soften demand conditions, typically with an estimated ~10-week lag—though liquidity is not the only driver.
- On-chain valuation looks neutral, not euphoric: BTC MVRV Z-Score fell to 0.75 (from 0.91), remaining in the 0–2 “neutral” zone, implying reduced valuation stress and no classic cycle-top overheating signal.
- Supply remains structurally tight: The 1+ Year HODL Wave rose to 60.59%, indicating a large portion of supply is inactive—supportive if demand returns, but it can also reduce immediate sell-side liquidity.
- Near-term price tone is flow-driven: Despite neutral on-chain signals, risk-off ETF flows are setting sentiment, reflecting faster-moving institutional positioning.
💡 Strategic Points
- Watch the “liquidity vs flows” tug-of-war: Cooling M2 growth weakens the macro backdrop, while ETF redemptions can translate into direct sell pressure or reduced marginal demand.
- ETF outflows are the immediate catalyst: U.S. spot BTC ETFs posted two straight outflow days, including -$290.42M (May 15) and -$648.64M (May 18); ETH spot ETFs extended to six consecutive outflow sessions, including -$86.31M (May 18).
- Interpret MVRV Z-Score as “heat check,” not a timing tool: Neutral MVRV suggests valuations aren’t stretched, but price can still fall if capital exits via ETFs or broader risk assets de-rate.
- Supply lock-up can amplify rebounds: With >60% of BTC unmoved for 1+ year, any renewed demand (ETF re-inflows, corporate buys) may have an outsized impact due to limited liquid supply.
- Key monitoring checklist: (1) stabilization in ETF flows, (2) re-acceleration of 7-week M2 momentum, (3) whether MVRV remains neutral while price reacts—signaling flows, not valuation, are dominant.
📘 Glossary
- Global M2: A broad measure of money supply (cash and near-cash instruments). Often used as a proxy for system-wide liquidity.
- Liquidity barometer (BTC): The idea that Bitcoin’s price can reflect changes in overall liquidity conditions, sometimes with a delayed response.
- MVRV Z-Score: A metric comparing market value to realized value to gauge relative over/undervaluation; values in 0–2 are commonly viewed as “neutral.”
- Realized value: The value of BTC based on the price when each coin last moved on-chain, used as a proxy for aggregate cost basis.
- 1+ Year HODL Wave: The share of BTC supply that hasn’t moved for at least one year; higher values suggest stronger long-term holding and reduced liquid supply.
- ETF net outflows: Net capital leaving an ETF (redemptions exceed creations), often reflecting risk-off positioning or profit-taking.
- Risk-off sentiment: A market environment where investors reduce exposure to volatile assets and prefer safer holdings or cash-like instruments.


Comment 0