 News
News  Coin Information
  About us
  Customer Service


Global liquidity indicators are showing signs of short-term fatigue, but Bitcoin (BTC) continues to look relatively inexpensive on key on-chain metrics as spot ETF inflows provide a steady bid underneath the market.
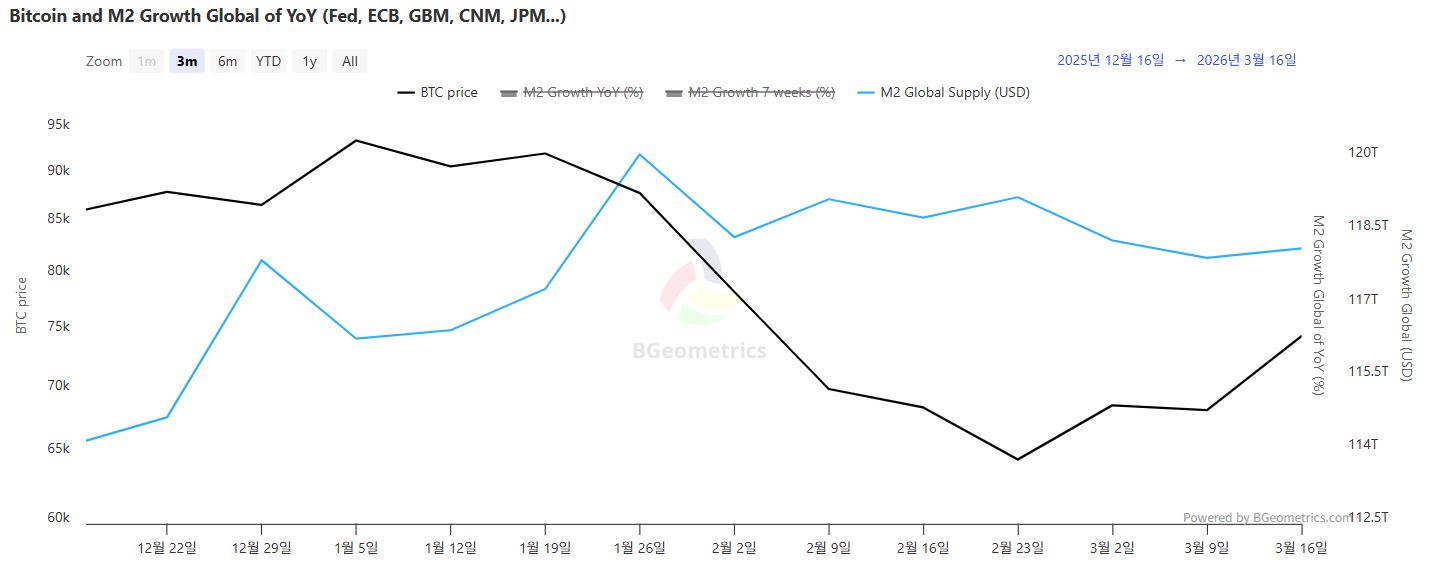
Data compiled by BizioMetrics put global M2 money supply at $118.18 trillion as of March 16, up 0.17% from $117.98 trillion a week earlier (March 9). The headline level suggests liquidity remains trapped in a narrow range rather than entering a clear expansion phase—a backdrop that typically limits risk-asset upside unless other demand channels accelerate.
The more immediate signal, however, has softened: the seven-week growth rate fell to -1.61%, a sharp reversal from the previous week’s 0.55%. That swing indicates the recent, modest pickup in liquidity has stalled, raising the risk of choppier price action across high-beta assets as traders adjust to a less supportive short-term monetary impulse.
Zooming out, the longer-term picture is less concerning. Year-over-year global M2 growth rose to 9.06% from 8.66% the week before, pointing to a gradual recovery in broad money trends even as shorter-term momentum cools. In practice, that combination—soft near-term flow but improving annual growth—often translates into a market that relies more heavily on positioning, sentiment, and idiosyncratic demand catalysts.
On-chain valuation gauges are still flashing restraint rather than exuberance. Bitcoin’s MVRV Z-score—a metric comparing market value to realized value to assess relative overvaluation or undervaluation—was measured at 0.69, up from 0.47 a week earlier. While the uptick reflects the recent price rebound, it remains in the lower end of the 0 to 2 'neutral' band, suggesting the market is not exhibiting the kind of froth typically associated with late-cycle peaks.
Holding behavior also points to limited distribution pressure. The 1+ Year HODL wave, which tracks the share of BTC supply that has not moved in at least a year, registered 59.66%, essentially flat but fractionally below 59.67% the prior week. The marginal decline hints at small-scale profit-taking by long-term holders during the recovery, yet the overall level remains elevated—consistent with continued conviction and a relatively tight pool of readily sellable coins.
Meanwhile, 'institutional demand' has been reinforced by persistent inflows into U.S.-listed spot crypto ETFs. According to Sosovalue, U.S. spot Bitcoin ETFs recorded $216.2 million in net daily inflows as of March 16 (ET), extending a streak to six consecutive trading days of net additions since March 9. The continuation of inflows has helped offset the softer short-term liquidity impulse implied by global M2.
Ethereum (ETH) products have also attracted fresh capital. Spot Ethereum ETFs posted $35.9 million in net daily inflows as of March 16 (ET), marking five straight trading days of net inflows since March 10. The data suggest that, even with macro liquidity no longer accelerating week to week, investors are still allocating to regulated crypto exposure—potentially as part of broader portfolio rebalancing and risk re-engagement.
Overall, the latest figures underscore a market being supported less by a breakout in global money growth and more by a combination of steady ETF demand and on-chain signals that remain far from historical overheating zones. Whether the next move is defined by renewed liquidity expansion or by continued product-driven inflows, the current setup places special focus on how long 'liquidity inflow' via ETFs can counterbalance softness in short-term macro momentum.
Article Summary by TokenPost.ai
🔎 Market Interpretation
- Macro liquidity is range-bound: Global M2 sits at $118.18T (+0.17% WoW), implying liquidity is not in a clear expansion regime—typically a headwind for broad risk-asset upside.
- Short-term impulse weakened materially: The 7-week growth rate flipped to -1.61% from +0.55%, signaling near-term “fuel” for high-beta assets has stalled and may increase choppiness.
- Longer-term trend improving: YoY M2 growth rose to 9.06% (from 8.66%), suggesting the macro backdrop is not deteriorating—just cooling in the near term.
- Bitcoin valuation looks restrained: BTC MVRV Z-score at 0.69 remains in the lower end of the 0–2 neutral band, indicating limited signs of cycle-top exuberance despite a rebound.
- Supply remains relatively tight: The 1+ Year HODL wave is ~59.66%, essentially flat, implying modest profit-taking but no major distribution from long-term holders.
- ETFs are acting as a demand backstop: U.S. spot BTC ETFs saw $216.2M net daily inflows (Mar 16 ET) with 6 straight days of net additions; spot ETH ETFs added $35.9M with 5 straight days—supporting prices even as macro liquidity momentum softens.
💡 Strategic Points
- Base case (push-pull market): Expect price action to be driven more by ETF flow persistence, positioning, and sentiment while global liquidity remains sideways.
- Key risk to monitor: If the short-term M2 slowdown persists (or deepens), ETF inflows must stay strong to offset weaker macro impulse; otherwise, volatility and pullbacks become more likely.
- Constructive signal: “Not-overheated” on-chain readings (low-neutral MVRV Z) suggest dips may find buyers if flow demand (ETFs) continues.
- Supply-side read-through: Stable HODL waves imply limited readily sellable supply; any demand acceleration (macro re-expansion or larger ETF inflows) can have an outsized price effect.
- Practical indicators to track next:
- Weekly ETF net inflows (trend + concentration by issuer)
- Global M2: 7-week growth inflection back above zero vs. further decline
- MVRV Z-score: move toward upper neutral (2) as an early overheating cue
- HODL wave changes: sustained declines could indicate broader long-term distribution
- Market implication: The current setup favors a selective risk-on posture—participation supported by regulated-product inflows, but with tighter risk controls due to softer macro momentum.
📘 Glossary
- Global M2 money supply: A broad measure of money in the economy (cash + checking deposits + easily convertible near-money). Often used as a proxy for system liquidity.
- WoW / YoY: Week-over-week and year-over-year percentage changes used to gauge short-term vs. long-term trend strength.
- High-beta assets: Assets that typically move more than the broader market (e.g., crypto), rising more in risk-on periods and falling more when liquidity tightens.
- On-chain metrics: Blockchain-derived indicators (e.g., valuation, holder behavior) used to assess market positioning and cycle conditions.
- Realized value (realized cap): A valuation method that values each coin at the price it last moved on-chain, approximating aggregate cost basis.
- MVRV Z-score: Standardized measure comparing market value to realized value; higher readings can indicate overheated conditions, lower readings can indicate undervaluation/early-cycle pricing.
- HODL wave (1+ Year): The share of supply that has not moved for at least one year; higher values generally imply stronger long-term holding and tighter liquid supply.
- Spot ETF inflows: Net new capital entering exchange-traded funds that hold the underlying asset (BTC/ETH), often interpreted as directional institutional/regulated-channel demand.


Comment 0