 News
News  Coin Information
  About us
  Customer Service


LTC/USD chart - Trading View
Exchange - Coinbase
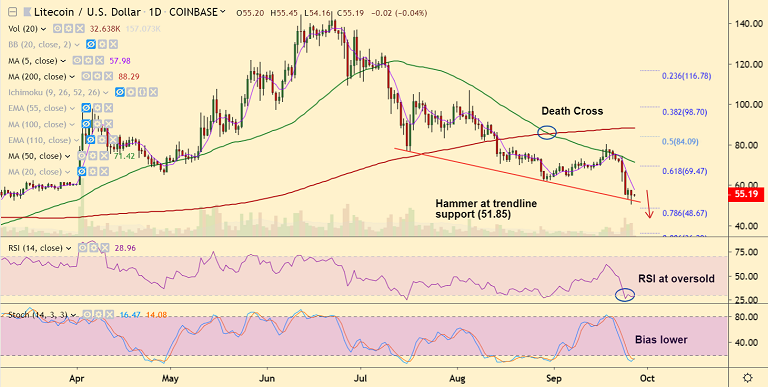
Support: 51.85 (Trendline); Resistance: 57.91 (5-DMA)
Technical Analysis: Bias Bearish
Litecoin trades in narrow range, was trading 0.69% lower on the day at 54.83 at 07:00 GMT.
The pair hit 6-month lows at 50.25 on Thursday's trade, before paring losses to close at 55.21.
Major trend is bearish, recovery attempts lack traction. 'Death Cross' limits upside.
On the other side, oscillators are at oversold levels and 'hammer' formation on the daily charts (Thursday) raises scope for upside.
Bullish divergence (RSI and Stochs) on the hourly charts has pushed price above 21H EMA.
Next hurdle lies at 5-DMA at 58.01. Break above will see further upside. On the other side, break below trendline support (51.85) will see resumption of weakness.


Comment 0