 News
News  Coin Information
  About us
  Customer Service


Exchange - Coinbase
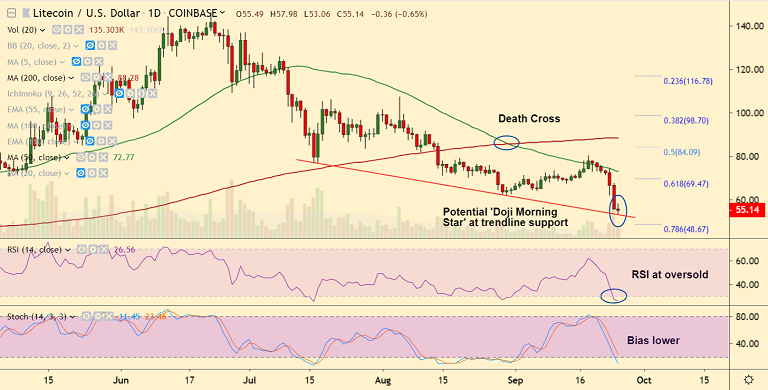
Major Support Levels:
S1: 53.00 (Trendline)
S2: 48.67 (78.6% Fib)
S3: 42.40 (Feb 27 low)
Major Resistance Levels:
R1: 57.97 (21H EMA)
R2: 64.38 (5-DMA)
R3: 69.47 (61.8% Fib)
Technical Chart:
LTC/USD chart - Trading View
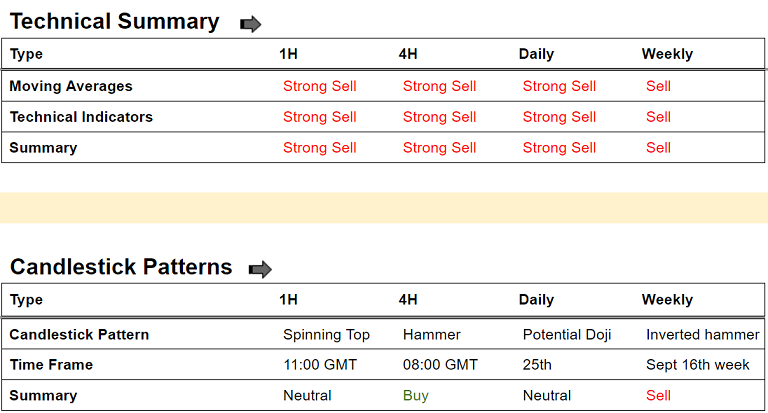
Summary: LTC/USD is holding support at 53.00 (falling trendline). Potential 'Doji Morning Star' and oversold oscillators suggest warning signs of pullback in the pair. Decisive break below 53 (trendline support) confirms further weakness.
Guidance: Stay short on decisive break below 53.00, stop loss: 58.00, target-1: 48.75, target-2: 43.00.


Comment 0