 News
News  Coin Information
  About us
  Customer Service


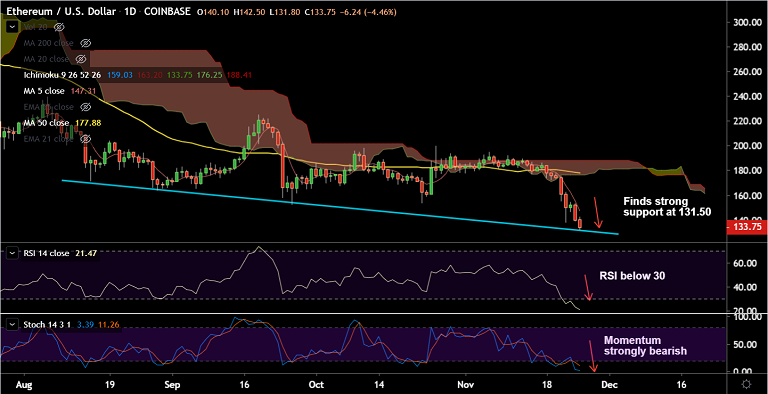
ETH/USD chart - Trading View
Exchange - Coinbase
Support: 131.50 (Trendline support); Resistance: 141.35 (78.6% Fib)
Technical Analysis: Bias strongly Bearish
ETH/USD is extending previous week's weakness, trades 4.96% lower on the day at 133.19 at 06:00 GMT.
The pair has hit 8-month lows below the $140 mark and more downside on charts.
Technical indicators are strongly bearish. Major and minor trend are bearish as evidenced by GMMA indicator. Volatility is rising.
Price action has broken below 78.6% Fib at 141.35, is on track for further weakness.
Strong trendline support is seen at 131.50. Break below will open up downside.
Next major support is seen at 122.75 (Mar 4th low), ahead of 112.96 (88.6% Fib).


Comment 0