(Refer ETH/USD chart on Trading View)
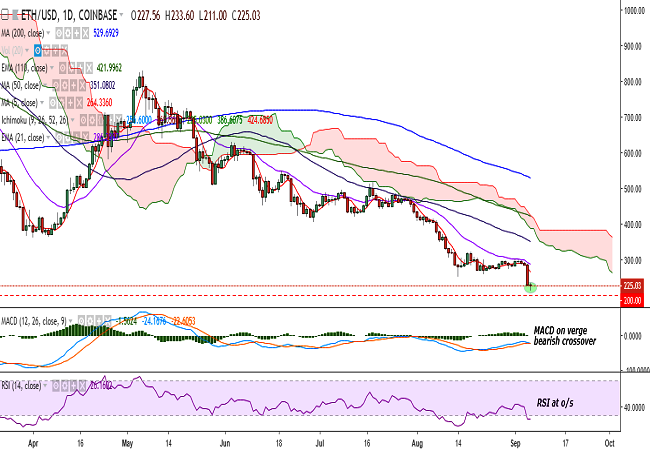
ETH/USD fell to a fresh 2018 low of 211 levels on Thursday, continuing the downtrend seen since yesterday.
The fall comes amid wider weakness in the cryptocurrency market as a whole. Ethereum price is down by over 28 percent so far this week.
The pair is trading at 225 levels at the time of writing, forming a doji pattern on the daily chart (Coinbase).
On the top side, the pair is likely to face resistance at 235 (1h 21-EMA) and a break above would see it testing 264 (5-DMA)/286 (21-EMA)/300.
On the downside, the pair appears to have found support near 215 (113% extension of 515.88 and 250.28) and further weakness would drag the pair to 200/178/150.
Bias has turned bearish on the daily chart with RSI at oversold levels, stochs biased sharply lower, and MACD on the verge of a bearish crossover. That said, the current doji formation suggests bulls might be trying to sustain the pair’s strength above 200.
Watch out for a break below 200 levels for further bearishness in the pair.
<Copyright ⓒ TokenPost, unauthorized reproduction and redistribution prohibited>







Comment 5