

 News
News  Coin Information
  About us
  Customer Service


 Add as a preferred source on Google
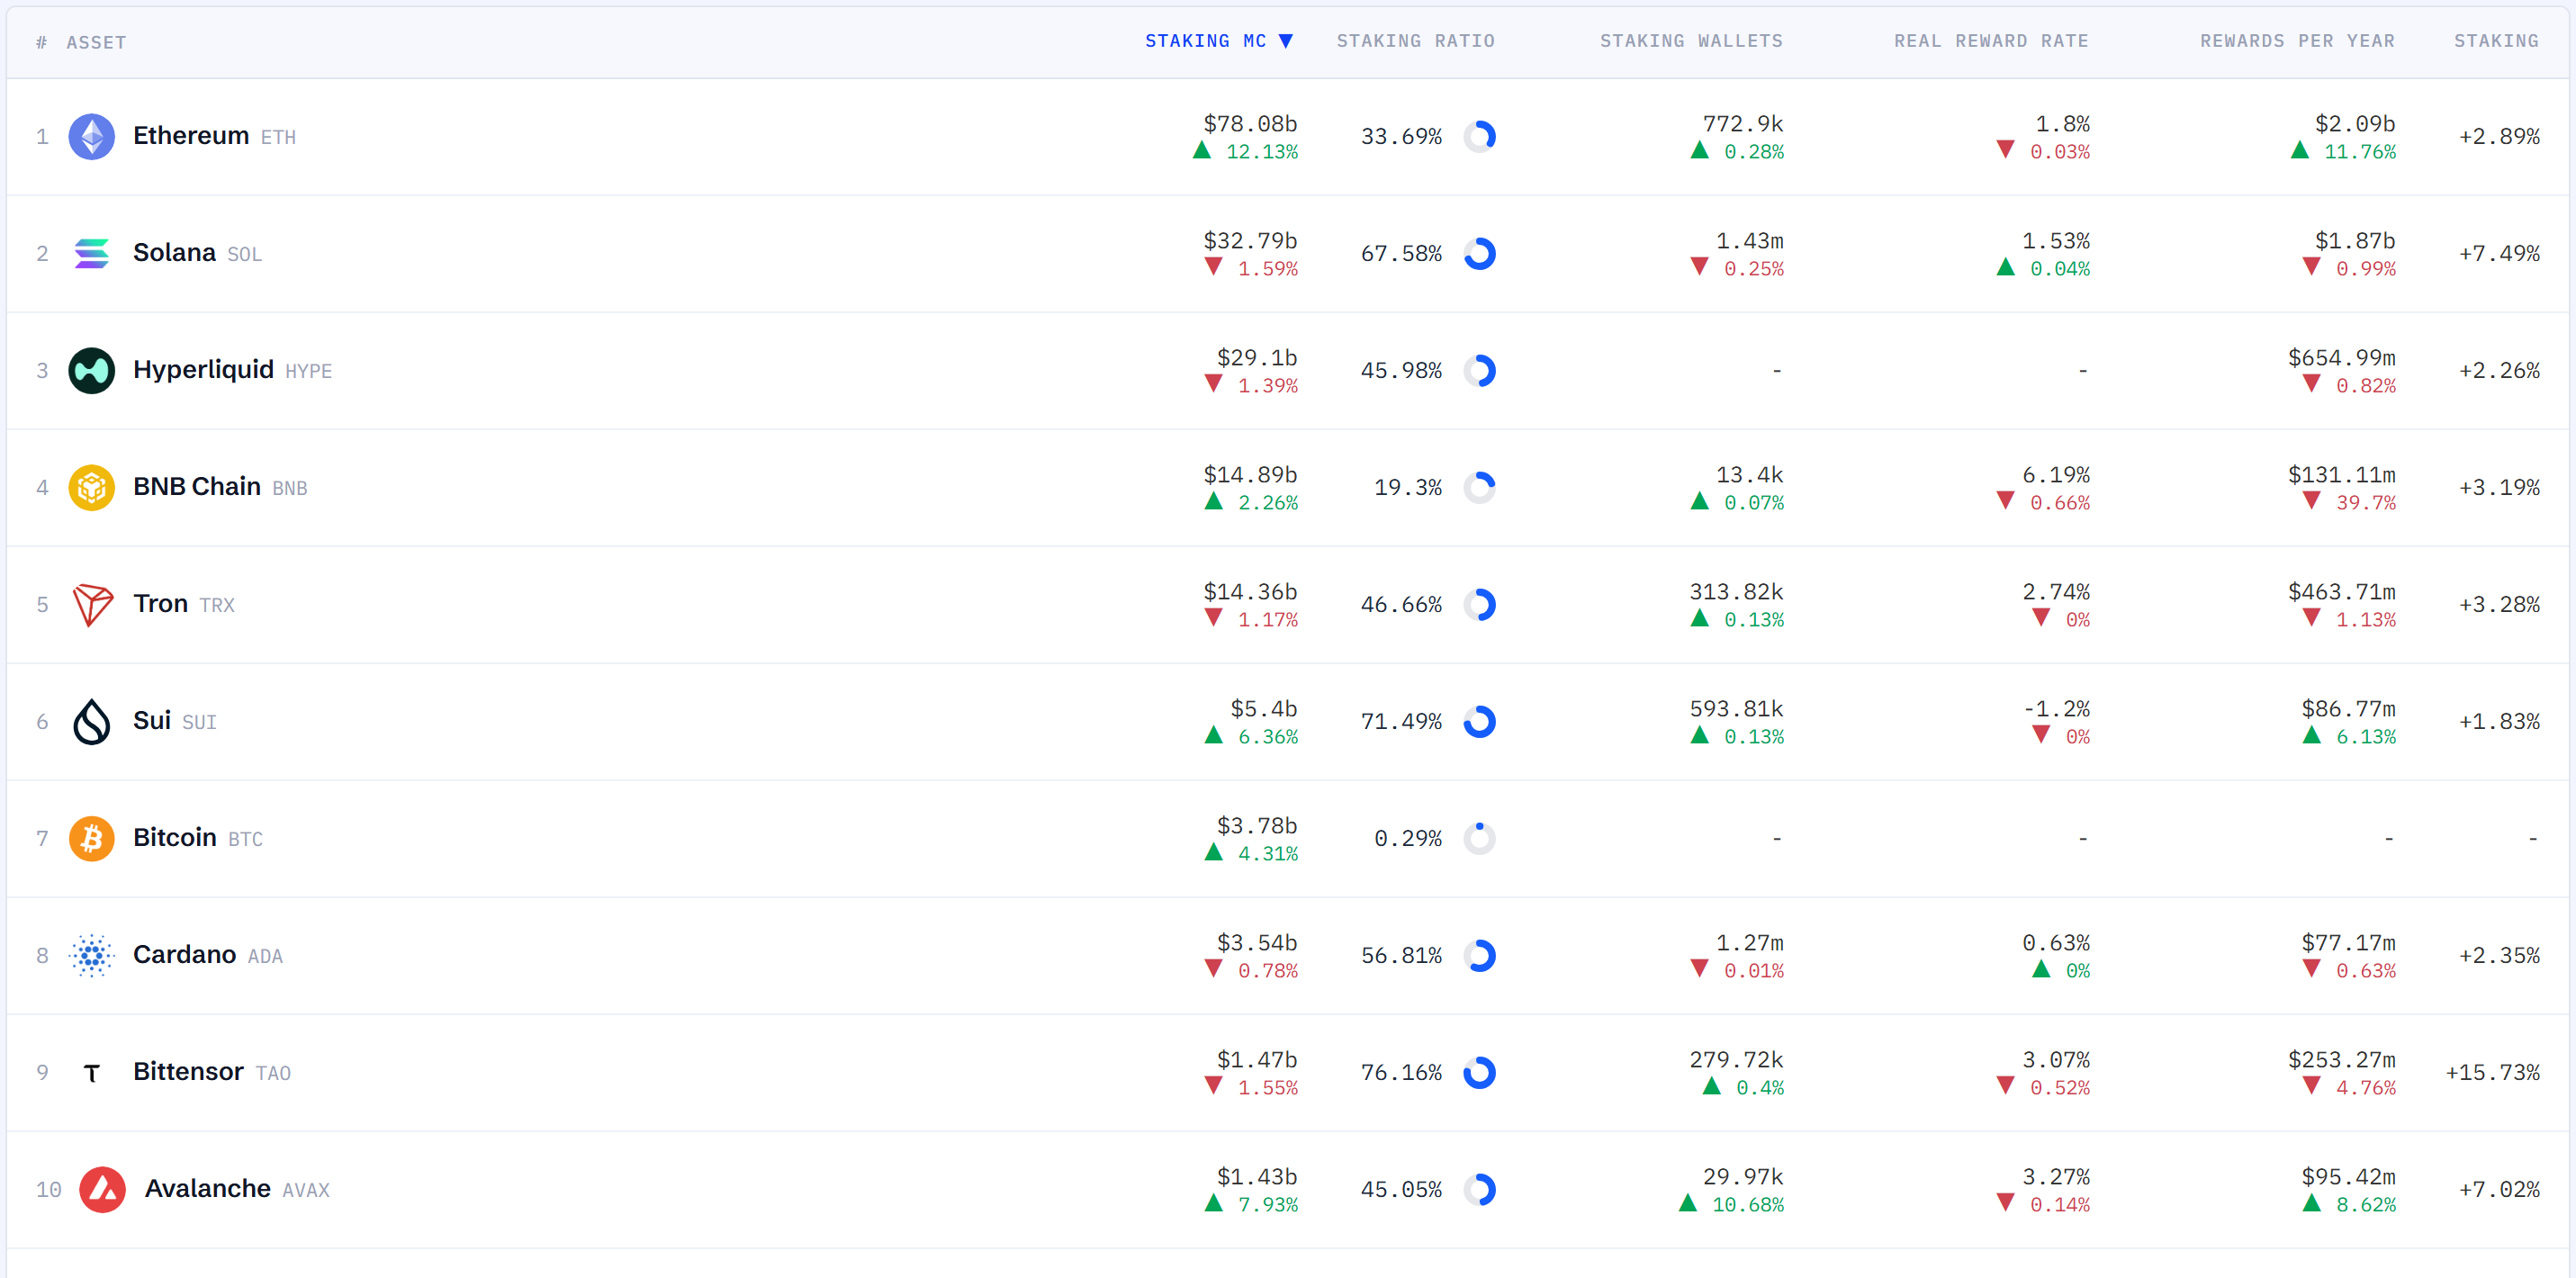
Ethereum (ETH) widened its lead at the top of the staking market over the past week, underscoring a renewed bid for large-cap networks even as several high-profile chains posted modest contractions. The latest snapshot highlights a familiar dynamic in staking: participation and rewards can remain resilient, but longer-term returns are still heavily shaped by price performance.
As of Wednesday 15 July at 10:50 p.m. ET, data compiled by StakingRewards showed Ethereum retaining the No. 1 position by staked market capitalization, rising 12.13% week over week to $78.08 billion. Solana (SOL) ranked second at $32.79 billion, down 1.59% on the week, while Hyperliquid placed third at $29.10 billion, dipping 1.39%.
BNB Chain (BNB) took fourth place with $14.89 billion in staked market cap, up 2.26%, and Tron (TRX) followed in fifth at $14.36 billion, down 1.17%.
Looking across weekly movers, Ethereum posted the strongest increase among the major assets tracked, while Avalanche (AVAX) also advanced sharply, up 7.93%. On the downside, Solana recorded the largest decline among the leaders, and Bittensor (TAO) fell 1.55%.
Participation metrics painted a mixed picture between intensity and breadth. By share of circulating supply staked, Bittensor led with a 76.16% staking ratio, followed by Sui (SUI) at 71.49% and Solana at 67.58%. Cardano (ADA) posted 56.81%, while Tron and Hyperliquid stood at 46.66% and 45.98%, respectively.
However, the number of staking wallets—often read as a proxy for retail and community participation—was highest on Solana at 1.43 million, ahead of Cardano at 1.27 million and Ethereum at 770,000. Avalanche stood out for wallet growth, with staking wallets rising 10.68% week over week, while most other networks saw only minor changes.
In terms of yield, BNB Chain continued to offer the highest “real” reward rate among the listed majors at 6.19%. Avalanche followed at 3.27%, with Bittensor at 3.07%, Tron at 2.74%, Ethereum at 1.80%, and Solana at 1.53%. Sui remained in negative territory at -1.20%, a data point that may reflect token emissions and market pricing that offset gross rewards.
Estimated annual reward totals still skewed heavily toward the largest networks. Ethereum led at roughly $2.09 billion in projected annual rewards, followed by Solana at $1.87 billion. Hyperliquid was estimated at $654.99 million, Tron at $463.71 million, and Bittensor at $253.27 million.
Week over week, estimated annual rewards increased for Ethereum (+11.76%), Avalanche (+8.62%), and Sui (+6.13%). In contrast, BNB Chain saw a steep 39.70% drop, while Bittensor (-4.76%) and Tron (-1.13%) also declined.
Pure staking ROI (annualized) continued to show wide dispersion across networks. Bittensor topped the ranking at 15.73%, while Solana posted 7.49% and Avalanche 7.02%. Tron (3.28%), BNB Chain (3.19%), and Ethereum (2.89%) clustered near the mid-single digits, with Cardano (2.35%), Hyperliquid (2.26%), and Sui (1.83%) lower.
But when the industry’s broader definition of “total staking ROI” is applied—combining both staking rewards and token price movement over the past 365 days—the picture flips for many chains. Hyperliquid recorded the strongest 1-year total return at 43.16%, and Tron was the only other asset in the top cohort to remain positive at 11.51%.
Most major staking assets posted negative 365-day total returns despite ongoing rewards: Sui fell -81.28%, Cardano -79.77%, Avalanche -69.29%, Bittensor -46.47%, Ethereum -44.86%, and BNB Chain -13.58%.
The takeaway for the staking market is increasingly clear: while rewards and participation remain meaningful indicators of network health and 'institutional demand', price direction continues to dominate realized outcomes. Ethereum’s weekly rebound in staked market cap suggests risk appetite is rotating back toward the largest, most liquid networks, even as the past year’s results show that staking alone has not been enough to offset broader drawdowns across much of the sector.
🔎 Market Interpretation
- Ethereum widened its staking lead: ETH remained the largest staking network by staked market cap, rising +12.13% WoW to $78.08B, reinforcing a rotation toward large-cap, liquid networks.
- Top ranking snapshot (staked market cap): Ethereum ($78.08B, +12.13%) led, followed by Solana ($32.79B, -1.59%), Hyperliquid ($29.10B, -1.39%), BNB Chain ($14.89B, +2.26%), and Tron ($14.36B, -1.17%).
- Mixed weekly momentum outside ETH: Avalanche also rose strongly (+7.93%), while Solana showed the largest decline among leaders and Bittensor slipped (-1.55%).
- Participation breadth vs. intensity diverged: High staking ratios (e.g., TAO 76.16%, SUI 71.49%, SOL 67.58%) did not necessarily correspond to the most wallets, where Solana led (1.43M) versus Ethereum (770k).
- Rewards resilient, outcomes price-driven: Despite ongoing yields and large projected annual rewards (ETH ~$2.09B; SOL ~$1.87B), 365-day “total staking ROI” remained negative for most majors, showing price performance dominates realized returns.
💡 Strategic Points
- Separate yield from total return: “Pure staking ROI” can look attractive (e.g., TAO 15.73%, SOL 7.49%), but the article shows that token price moves over 12 months often overwhelm rewards (e.g., ETH -44.86% total staking ROI over 365 days).
- Watch staked market cap as a risk-on signal: ETH’s sharp weekly increase suggests renewed appetite for established networks; investors may treat this metric as a sentiment/positioning indicator rather than a promise of positive total returns.
- Use wallet counts to gauge community traction: Solana’s 1.43M staking wallets and Avalanche’s +10.68% WoW wallet growth may point to stronger retail/community participation than networks with higher staking ratios but fewer wallets.
- Real yield differences matter—especially when prices stall: Among listed majors, BNB Chain’s real reward rate (6.19%) led, while Sui (-1.20%) was negative—highlighting how emissions and market pricing can negate nominal rewards.
- Focus on sustainability of rewards flow: Estimated annual rewards rose for ETH (+11.76%) and AVAX (+8.62%), but BNB Chain’s estimated annual rewards fell -39.70%, a notable shift that may affect validator economics and staking appeal.
- Risk framing for stakers: The article reinforces a practical takeaway: staking may support network health and provide cashflow-like rewards, but it is not a hedge against prolonged drawdowns across the sector.
📘 Glossary
- Staked market capitalization: The total USD value of tokens currently staked (locked or delegated) on a network; often used to compare the size of staking ecosystems.
- Staking ratio: The percentage of a token’s circulating supply that is staked. Higher ratios can imply strong security/commitment but may reduce liquid float.
- Staking wallets: The number of distinct wallets participating in staking; commonly interpreted as a proxy for participation breadth (often retail/community engagement).
- Real reward rate: A yield measure that attempts to account for dilution/emissions and other adjustments rather than just nominal payout; can be negative if dilution/price effects outweigh rewards.
- Estimated annual rewards: Projected total USD value of staking rewards distributed over a year based on current staking levels and reward parameters.
- Pure staking ROI (annualized): Return from staking rewards alone, annualized, excluding token price changes.
- Total staking ROI: A broader measure combining staking rewards and token price performance over a defined period (here, 365 days); demonstrates realized investor outcome more directly.
- WoW (week over week): A comparison of metric changes versus the prior week.


















Comment 0