 News
News  Coin Information
  About us
  Customer Service


Solana (SOL) is attempting to push through a key technical ceiling near $82, a level traders are treating as a near-term inflection point after the token rebounded sharply from early-July lows. The move matters because a clean break above this zone could shift market focus from a relief rally to a more durable recovery—while a rejection would reinforce the view that SOL remains trapped below major trend indicators.
As of Thursday ET (July 3), Solana was trading at $82.71, up 2.20% over the past 24 hours, according to market data cited by local reports. The token is up 14.93% on the week, extending a rebound that began after SOL found support around the mid-$70s and reclaimed the psychologically important $80 handle.
Technical analysts are closely watching the area around $82.26, described in Elliott Wave-based chart work as the 61.8% Fibonacci retracement—often treated as a decisive resistance zone in corrective market structures. If SOL can establish acceptance above that level, the next upside targets being discussed cluster around prior swing highs at $89.40, then $94 and $98.
On the downside, short-term market structure is increasingly defined by a narrow support band between $77.15 and $80. Analysts say that holding this range is critical to preserving the current upside momentum; a slide back into it would likely invite a retest-driven, choppy consolidation rather than a straightforward continuation higher.
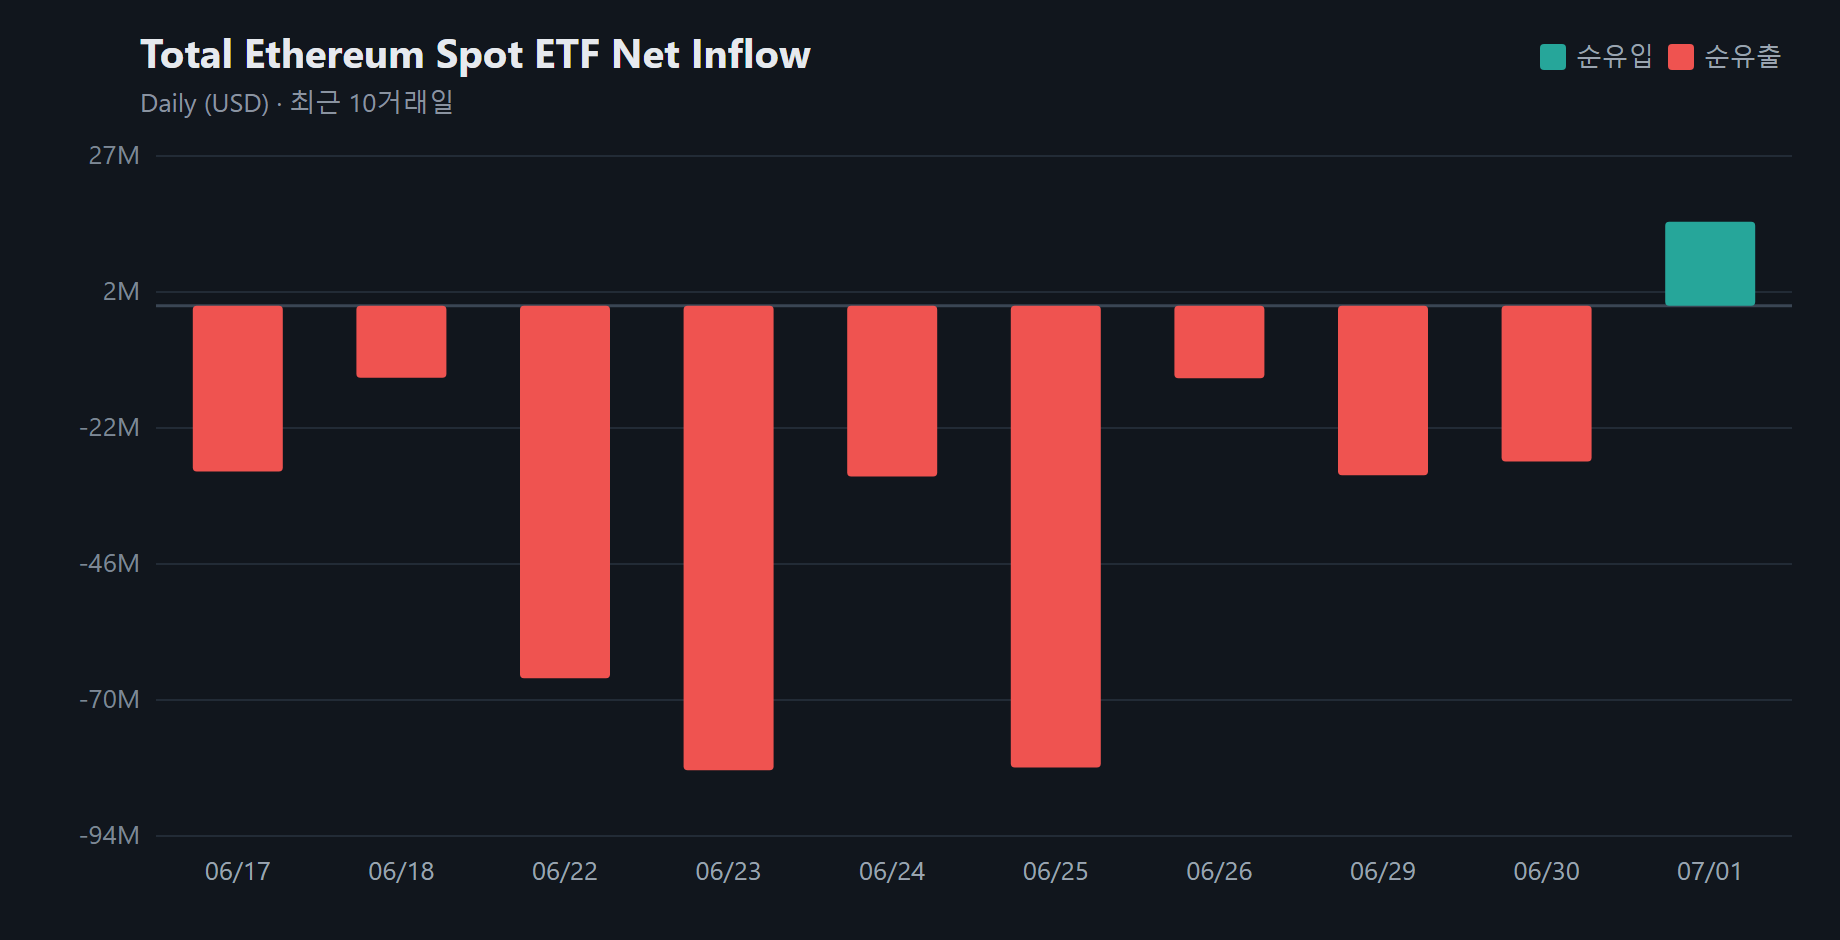
The latest derivatives and flow indicators cited in the report lean cautiously constructive. Open interest has stabilized, while spot outflows have eased—signals that immediate sell pressure may be fading after weeks of persistent distribution. At the same time, the pace of activity has cooled: Solana’s 24-hour trading volume was roughly $2.18 billion, down 50.44% from the prior day, suggesting volatility has compressed as the market approaches resistance.
Liquidity remains overwhelmingly concentrated on centralized venues. Centralized exchanges accounted for 99.99% of the day’s SOL turnover—about $2.18 billion—while decentralized exchange volume was just $12,212, underscoring that the current move is being driven primarily by CEX-based positioning rather than a broad-based surge in on-chain trading.
By size, Solana’s market capitalization stood at about $48.06 billion, ranking seventh across digital assets with an estimated 2.21% market share. Circulating supply was reported at around 581.01 million SOL, roughly 92.3% of the total supply of 629.58 million.
Performance metrics across time frames reflect a rebound that is strong in the short run but less decisive when viewed through a medium-term lens. SOL is up 15.91% over the past month and still slightly positive over 90 days (+2.32%), but the 60-day return remains mildly negative (-1.71%), echoing the drawdown from mid-May through mid-June when price traded below key moving averages and momentum turned technically bearish.
Notably, the report points to an absence of major ecosystem catalysts. There were no confirmed announcements on protocol upgrades, governance changes, or flagship launches tied to the latest price action, leaving traders focused primarily on chart levels and positioning. Prediction markets and other speculative venues have also seen heightened attention around whether SOL can close the day higher—another sign that near-term sentiment is being driven more by tactical trading than fundamentals.
For now, analysts characterize the setup as a rebound that still needs confirmation. A sustained influx of buyers—and a clear reclaim of major moving averages—would help validate a broader trend shift. Until then, Solana’s rally remains a technically led recovery that could either build into a breakout above ‘Fibonacci resistance’ or stall and rotate back toward the $77–$80 support zone.
🔎 Market Interpretation
- Key inflection zone: SOL is testing the ~$82 ceiling (highlighted at $82.26), with traders treating this area as the decision point between a mere bounce and a more durable recovery.
- Rebound context: Price rebounded from mid-$70 support, reclaimed the psychological $80 level, and is up ~15% on the week—strong short-term momentum, but mixed across mid-term windows.
- Resistance-driven pause risk: A rejection near $82 could reinforce that SOL remains capped under major trend indicators, potentially triggering choppy consolidation instead of continuation.
- Positioning signals: Open interest stabilizing and easing spot outflows suggest near-term sell pressure may be fading, but the sharp drop in volume (~50% day/day) implies volatility is compressing as price meets resistance.
- Market structure focus over fundamentals: With no major ecosystem catalysts reported, the move is being interpreted primarily through technical levels, flow/derivatives positioning, and short-term sentiment.
- Venue concentration: Activity is overwhelmingly CEX-led (99.99% of turnover), indicating the rally is currently driven more by centralized positioning than broad on-chain demand.
💡 Strategic Points
- Bull confirmation trigger: A sustained hold above ~$82.26 (61.8% Fibonacci retracement) would be viewed as “acceptance” and could shift trader focus to upside continuation.
- Upside roadmap (if breakout holds): Next levels discussed are prior swing zones around $89.40, then $94 and $98—areas where profit-taking or renewed selling may appear.
- Critical support band: The $77.15–$80 range is the near-term line in the sand; losing it likely invites retest-driven chop and undermines the current rebound structure.
- Volume caution: Falling volume into resistance can mean either (a) seller exhaustion before breakout or (b) weakening demand; traders may watch for volume expansion on a move above $82 to validate strength.
- Trend validation checklist: Beyond reclaiming $82, analysts want a reclaim of major moving averages and persistent buyer inflows to confirm a broader trend shift.
- Risk framing: Until confirmation, the rally is characterized as technically led—more vulnerable to reversal on failed resistance tests than a fundamentals-driven uptrend.
📘 Glossary
- Inflection point: A price area where direction may change or accelerate, often producing a breakout or rejection that shapes near-term trend.
- 61.8% Fibonacci retracement: A common technical level derived from Fibonacci ratios; frequently acts as resistance in corrective rallies and support in pullbacks.
- Elliott Wave: A framework that interprets market moves as recurring wave patterns tied to crowd psychology, often paired with Fibonacci levels.
- Acceptance (above a level): When price not only breaks a level but holds/settles above it, suggesting the market is willing to transact at higher prices.
- Open interest: The number of outstanding derivatives contracts; stabilization can indicate cooling forced unwinds or a pause in aggressive repositioning.
- Spot outflows: Net movement of assets off spot venues; easing outflows can imply reduced immediate selling pressure.
- Moving averages: Trend indicators smoothing price over time; trading below key averages is often read as bearish, reclaiming them as improving trend.
- CEX vs DEX volume: Centralized vs decentralized exchange trading activity; heavy CEX dominance can imply positioning-led moves rather than on-chain demand expansion.
- Psychological level: A round-number price (e.g., $80) that attracts attention and can influence order placement and sentiment.


Comment 0