 News
News  Coin Information
  About us
  Customer Service


Solana (SOL) is back at a make-or-break zone after a sharp rejection at the $100 level, with traders now watching whether bids can hold the $92–$94 area that has emerged as the market’s immediate line in the sand. The move matters because this band has become the key checkpoint for SOL’s recent recovery structure—and a failure could quickly shift momentum back toward a deeper pullback.
As of May 13 UTC, Solana was trading at $90.93, down 3.98% over the past 24 hours. The token has rallied off an early-April low near $76, pushing through successive levels around $82, $86, and $90 as prior resistance flipped into support. Market capitalization stood at roughly $52.56 billion, placing Solana seventh among cryptocurrencies, while 24-hour trading volume was about $4.44 billion, up 0.76% day over day.
Supply dynamics remain a point of relative comfort for bulls. About 578 million SOL are in circulation—roughly 92.3% of the reported total supply of 626.35 million—leaving less room for near-term dilution than assets with a much lower circulating ratio. Solana’s fully diluted valuation (FDV) was estimated at about $56.96 billion, suggesting incremental supply overhang may be limited compared with earlier stages of the network’s lifecycle.
Technicians are split between near-term caution and longer-term optimism. On higher timeframes, several analysts point to a weekly-chart break above a downtrend line that formed after a 2025 peak. Crypto analyst CryptoCurb argued the setup resembles a 2021-style breakout pattern and floated a long-range target of $1,000—conditional on SOL defending the current support region and maintaining a sequence of higher highs and higher lows.
Others are more focused on the immediate structure. Analyst Sebi, commenting on the four-hour chart, said holding the current support could open the door to another attempt at higher levels, while a clean break below $92 may expose a slide toward $86–$88. The relative strength index (RSI), a momentum indicator often used to gauge 'overbought' conditions, has also been cited as a warning that the recent run may have become stretched—raising the odds of consolidation or a corrective leg before any sustained advance.
Data tracked by CryptoRank.io suggests SOL has recently converted $82, $86, and $90 from resistance into support—typically a constructive sign for trend credibility. The market is now testing whether $92–$94 can serve the same function, particularly after the psychological and technical barrier at $100 capped price on May 12, according to Investing.com.
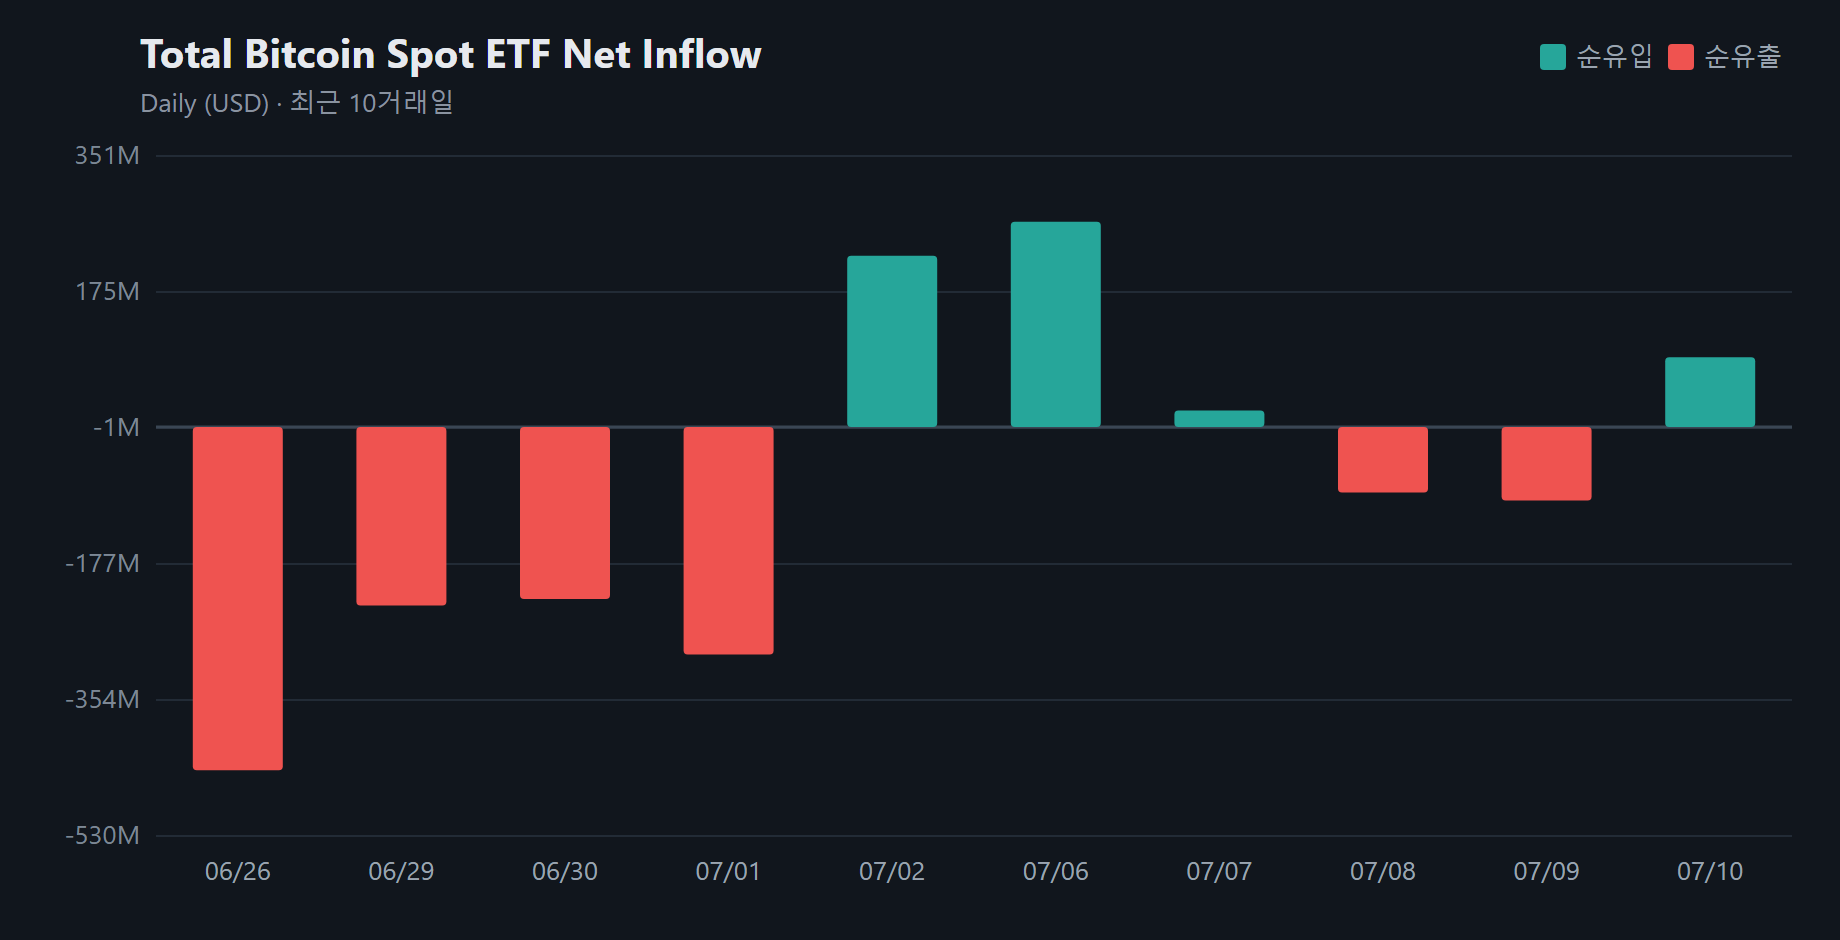
Institutional positioning remains part of the bullish narrative. The report pointed to increased inflows tied to Solana ETF products this week, framing the demand as a potential buffer against sell pressure. While the article did not cite specific issuers or jurisdictions, the broader takeaway is that sustained ETF-related buying can act as a stabilizer during pullbacks by absorbing spot supply and improving sentiment around 'institutional demand'.
On performance metrics, Solana is still holding onto a positive trend over multiple windows despite the latest dip. SOL was up about 2.10% over seven days, 9.23% over 30 days, 4.48% over 60 days, and 17.10% over 90 days. Its market share was estimated at 1.98%, ranking it seventh among major altcoins.
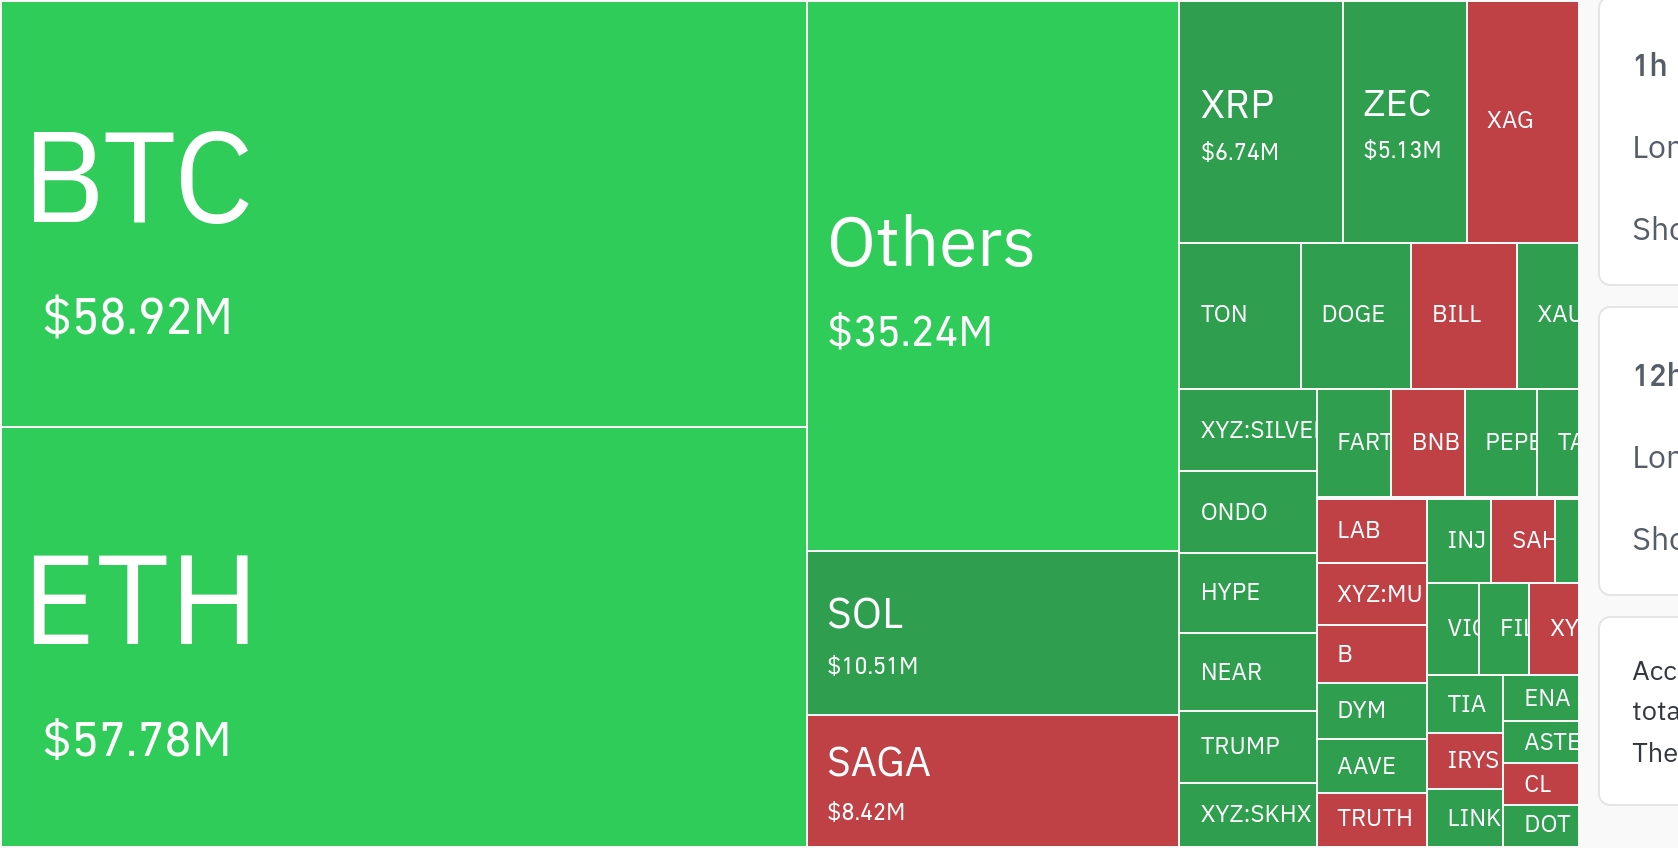
One notable feature of the current tape is where liquidity is concentrated. Of the roughly $4.44 billion in daily trading volume, nearly all activity occurred on centralized exchanges, with decentralized exchange volume described as negligible by comparison. CoinMarketCap data cited SOL trading across more than 1,129 pairs, reflecting broad accessibility on major venues such as Binance, Coinbase, and Upbit.
Commentary from Coinpaper.com’s Tia Avet echoed the market’s central tension: the weekly breakout and support flips remain constructive, but short-term momentum indicators and the $100 rejection could keep price volatile. For now, the $92–$94 region is the pivot. If it holds, bulls may view the pullback as a reset before another upside attempt; if it breaks, a move toward the mid-to-high $80s becomes a more immediate risk.
Meanwhile, the debate around the $1,000 target underscores the gap between technical projections and market-cap reality. A price at that level would imply a valuation north of $500 billion—approaching Ethereum-scale territory—leading some to call the forecast overly optimistic. Still, supporters argue Solana’s expanding footprint across DeFi, NFTs, and high-velocity trading niches, alongside its low-fee, high-throughput design, keeps the long-term upside case alive if adoption and ETF participation continue to broaden.
For the market now, the conclusion is straightforward: Solana is in a short-term cooling phase after failing to clear $100, but the medium-term structure is intact in the eyes of many analysts. Whether buyers can defend $92–$94 is likely to determine the next decisive swing.


Comment 0