 News
News  Coin Information
  About us
  Customer Service


Ripple (XRP) is hovering in a tight range around the mid-$1.30s, leaving traders split on whether the next move is a breakout or another pullback. Several leading AI models broadly agree that a short-term rebound remains intact, but they also flag the $1.40–$1.45 area as the decisive ‘resistance zone’ that could cap upside without a clear return of volume.
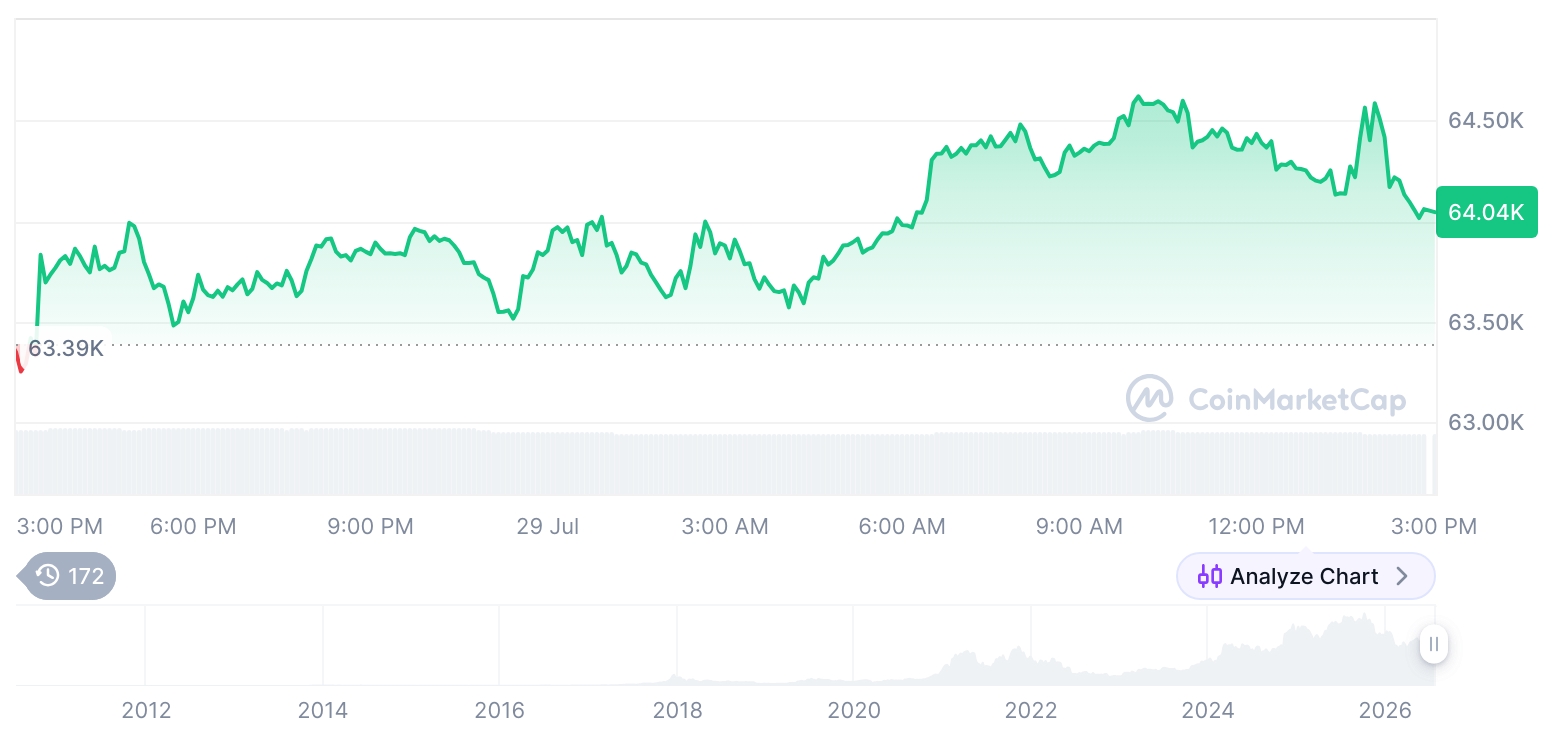
As of Thursday ET, XRP has been oscillating between roughly $1.32 and $1.40, making tentative upward progress as short-term lows edge higher. The setup, however, is complicated by sharply thinner turnover and the fact that XRP remains in a longer-term downtrend—conditions that often turn rallies into fragile, stop-and-start advances.
OpenAI’s GPT-5.2 characterizes the current tape as a test of the ‘top of the range.’ With the relative strength index (RSI) near 55—typically interpreted as constructive but not overheated—the model sees room for additional gains. Still, it highlights $1.40–$1.45 as a heavy supply band, suggesting that a clean break above $1.40 could extend toward $1.45, while a failure that drags price under $1.32 may accelerate a drop toward $1.30 or lower.
Anthropic’s Claude Sonnet 4.6 takes a more valuation- and trend-oriented approach, emphasizing that XRP is still trading about 30% below its 200-day simple moving average (SMA200), placing it in what the model calls an ‘undervalued zone’ relative to that long-term benchmark. That gap can imply rebound potential, but it also underscores that the broader downtrend remains unresolved. Claude similarly points to $1.40–$1.45 as the short-term ceiling and argues that, without meaningful volume participation, the probability of a failed breakout increases. It assigns a 70% likelihood to continued range trading, indicating a market that may remain in wait-and-see mode.
xAI’s Grok 4.1 is more focused on near-term positioning and momentum. It notes that recent highs have inched upward for three straight sessions, signaling that buyers are still present, but identifies the most immediate risk as a steep contraction in trading activity—down as much as 97% by its estimate. With RSI in the mid-50s, the model judges momentum as modest rather than forceful. Grok suggests that a push through approximately $1.395 could open a brief move toward $1.42, but warns that rejection near resistance raises the odds of a retest of $1.30 support.
Taken together, the three models describe a market in a precarious ‘rebound attempt’—price action is constructive on the surface, but the rally is occurring amid weak volume and beneath a longer-term bearish structure. In practical terms, the $1.32 support line and the $1.40 resistance line form the key decision corridor where liquidity and sentiment could quickly shift.
Over the next 24 hours, the clustered forecasts outline three primary paths. First, a breakout above $1.40 could expand into the $1.43–$1.45 region if follow-through buying appears. Second, a breakdown below $1.32 could widen losses and pull XRP under $1.30 in a fast move. Third, if volume remains depressed, the most likely outcome is an extension of the $1.32–$1.40 range, with volatility contained but direction unresolved.
Each model also provided probabilistic and directional targets: GPT-5.2 cited an expected high near $1.45 and a potential low around $1.30, with a 58% chance of a rebound; Claude projected an expected high near $1.435 and a low around $1.352, also assigning a 58% rebound probability; Grok estimated an expected high near $1.42 and a low around $1.31, with a 48% rebound probability.
In technical terms, RSI is commonly used to gauge the strength of recent gains versus losses, with readings above 50 often associated with positive momentum and readings below 30 frequently interpreted as oversold conditions. The SMA200 is widely watched as a long-term trend filter—prices below it are often viewed as structurally weak. Fibonacci retracement levels are also frequently used to identify potential support and resistance during corrections and rebound attempts.
Still, these signals are probabilistic rather than predictive. Crypto prices can pivot rapidly on shifting liquidity, macro headlines, and changes in risk appetite. For XRP, the near-term narrative remains a tug-of-war between ‘undervaluation rebound’ arguments and the persistence of a longer-term downtrend—making volume recovery and the market’s reaction to $1.40 the central variables to watch.
🔎 Market Interpretation
- Current regime: XRP is range-bound, oscillating roughly between $1.32 support and $1.40 resistance, with slightly higher short-term lows suggesting a tentative rebound attempt.
- Key tension: Price action looks mildly constructive, but the move is occurring with thin/contracting volume and below long-term trend levels, making rallies prone to failure.
- Decisive zone: The $1.40–$1.45 area is repeatedly identified by multiple models as a major supply/resistance band; without volume returning, upside may stall there.
- Momentum read: RSI ~ mid-50s is interpreted as positive-but-not-strong momentum—supportive of a grind higher, but not confirming a breakout.
- Trend backdrop: XRP remains in a longer-term downtrend; one model notes it is ~30% below SMA200, framing this as “undervalued” vs that benchmark but still structurally weak.
- Model consensus: The base case is continued range trading unless liquidity/volume changes; one model assigns ~70% likelihood to ongoing consolidation.
💡 Strategic Points
- Decision corridor to monitor:
- Support: $1.32 (loss of this level increases odds of a fast move toward $1.30 or lower).
- Resistance: $1.40 (clean break can target $1.43–$1.45 if follow-through buying appears).
- Three primary 24h paths (as outlined):
- Breakout: Above $1.40 → expansion toward $1.43–$1.45 (requires improved volume/participation).
- Breakdown: Below $1.32 → acceleration risk toward $1.30 and potentially under it.
- Base case: Volume stays depressed → continued chop in the $1.32–$1.40 band with contained volatility.
- Volume is the validation signal: A breakout attempt into $1.40–$1.45 is more credible if volume expands; otherwise, rejection risk remains elevated.
- Model target ranges (expected high/low):
- GPT-5.2: High ~$1.45, Low ~$1.30; rebound probability ~58%.
- Claude Sonnet 4.6: High ~$1.435, Low ~$1.352; rebound probability ~58%; range continuation probability ~70%.
- Grok 4.1: High ~$1.42, Low ~$1.31; rebound probability ~48%; flags extreme activity contraction (estimated up to 97%).
- Practical risk framing: Thin liquidity can cause “stop-and-start” moves; traders may see sharper wicks around $1.40 and accelerated downside if $1.32 fails.
- Headline sensitivity: The article stresses signals are probabilistic; macro/risk-on shifts and liquidity changes can quickly invalidate technical setups.
📘 Glossary
- Resistance: A price zone where selling pressure often emerges, potentially capping gains (here: $1.40–$1.45).
- Support: A price level/zone where buying interest often appears, potentially limiting declines (here: $1.32, then $1.30).
- RSI (Relative Strength Index): Momentum oscillator (0–100). Readings above 50 often suggest bullish bias; below 30 is commonly viewed as oversold.
- SMA200 (200-day Simple Moving Average): Long-term trend filter. Price below SMA200 is often interpreted as a structurally bearish trend.
- Volume/Turnover: Measure of trading activity. Rising volume can confirm breakouts; falling volume can signal fragile moves and higher failure risk.
- Fibonacci Retracement: Technical tool using key ratios to estimate potential support/resistance during pullbacks and rebounds.
- Range-bound / Consolidation: Price oscillates between defined support and resistance without establishing a clear trend.
- Breakout / Breakdown: Price moving decisively above resistance (breakout) or below support (breakdown), often with increased volatility.


Comment 0