BTC/USD chart - Trading View
Exchange - Coinbase
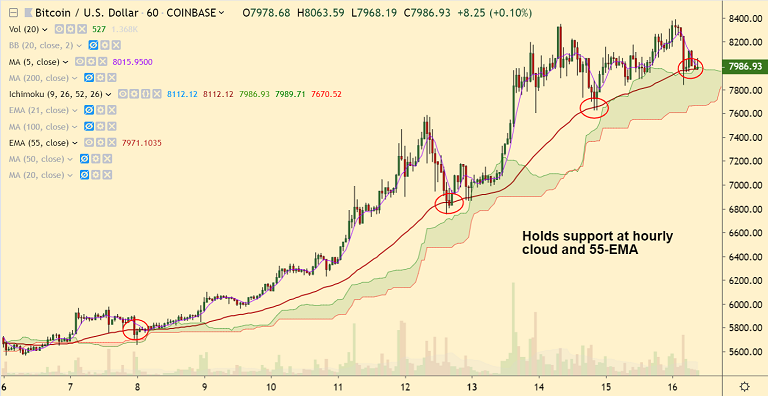
Support: 7970 (1H 55-EMA); Resistance: 8488 (July 2018 high)
Technical Analysis: Bias Bullish
BTC/USD has paused upside and is extending sideways for the 3rd straight session
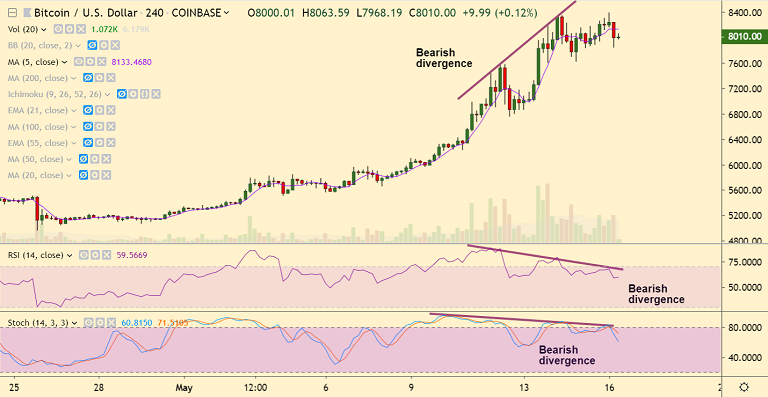
Major trend is definitely bullish, with no major indication of reversal. That said, a healthy correction likely.
Price action has formed a spinning top at highs suggesting indecision among bulls
The 4 hourly charts show bearish divergence on RSI and Stochs which adds to the bearish bias

Oscillators are at overbought levels, and volatility on the intraday charts is shrinking
The pair is currently holding support at hourly cloud and 55-EMA, break below will see weakness
For details on FxWirePro's Currency Strength Index, visit http://www.fxwirepro.com/currencyindex.


Comment 0