 News
News  Coin Information
  About us
  Customer Service


BTC/USD chart - Trading View
Exchange - Coinbase
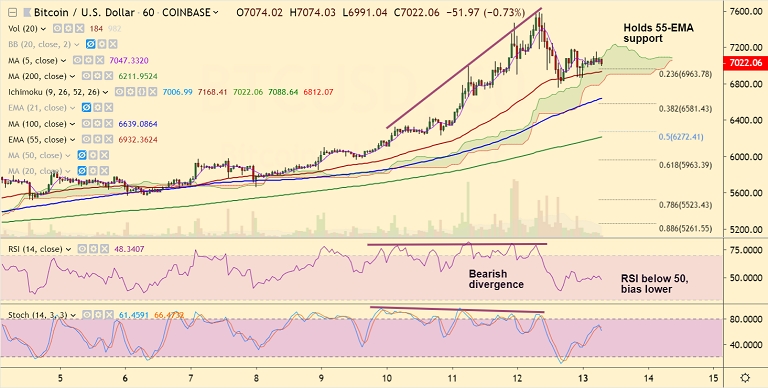
Support: 5950 (21-EMA); Resistance: 7777 (June 2018 high)
Technical Analysis: Bias Bullish
BTC/USD corrects lower from 10-month highs at 7581 hit on May 12th trade.
The pair still holds bullish momentum and does not show any major signs of correction.
Immediate support seen at 1H 55-EMA at 6932, break below will see weakness.
Price action has dipped into hourly cloud and we see bearish divergence on RSI and Stochs which supports downside.
Break below 1H 55-EMA will see dip till 1H 100-SMA at 6640, and further weakness will take the pair till 1H 200-SMA at 6212.
On the daily charts, 21-EMA is strong support at 5950. Resumption of upside will find next resistance at 7777 (June 2018 high).
For details on FxWirePro's Currency Strength Index, visit http://www.fxwirepro.com/currencyindex.
Crypto Technicals: BTC/USD correction from 10-month highs finds support at 1H 55-EMA, break below to see dip till 6600
<Copyright ⓒ TokenPost, unauthorized reproduction and redistribution prohibited>


Comment 0