 News
News  Coin Information
  About us
  Customer Service


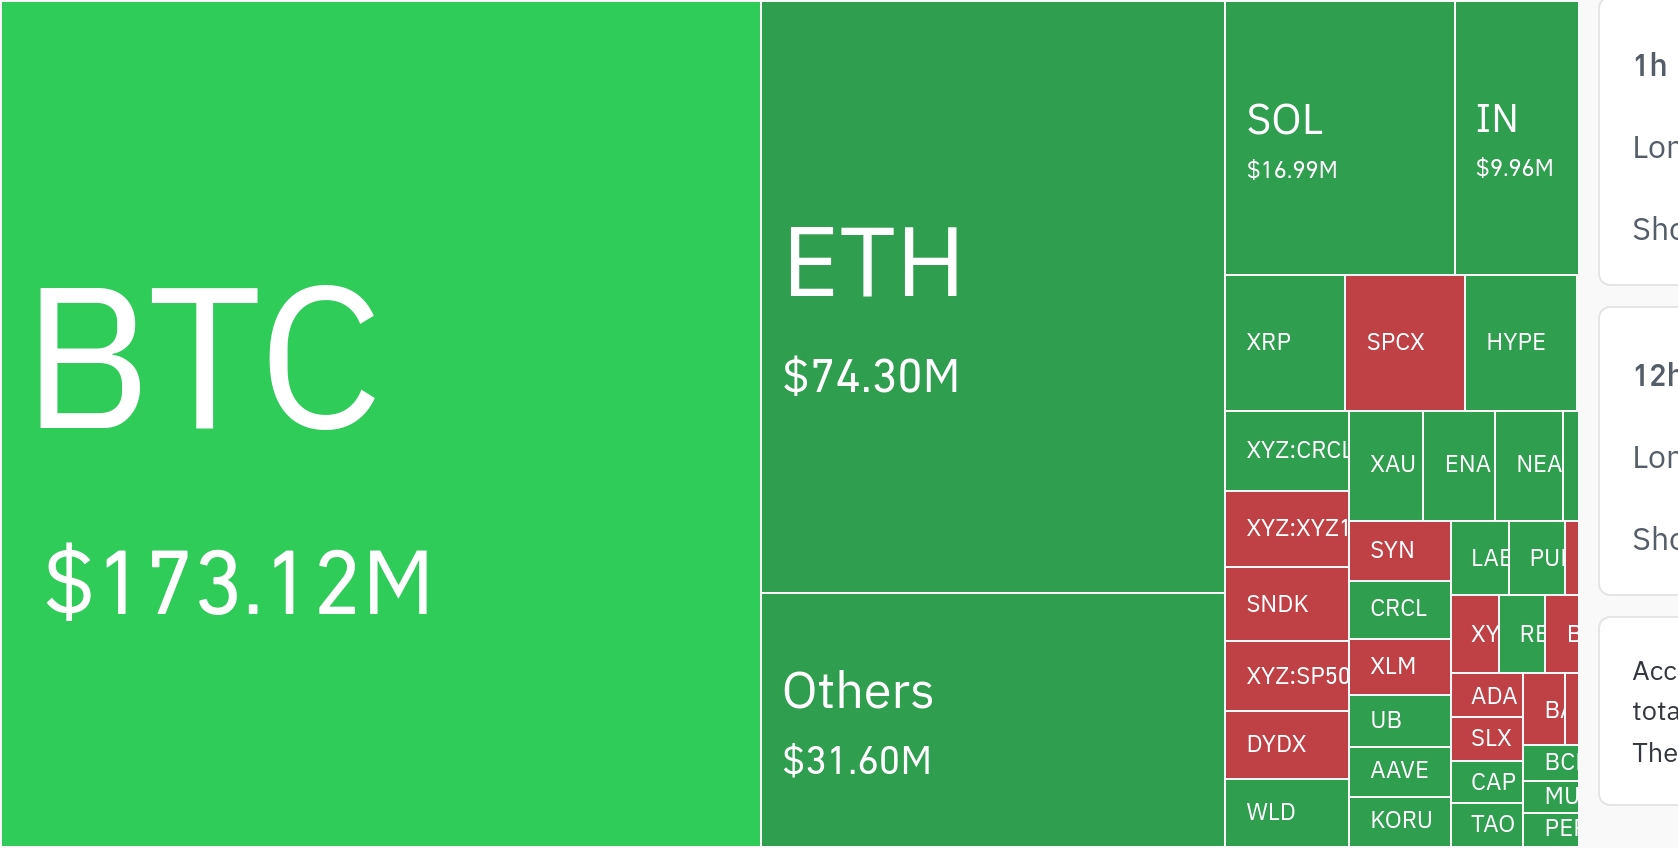
Solana (SOL) led this week’s shift in the proof-of-stake landscape, posting a sharp rise in ‘staked market cap’ and reinforcing its position as the second-largest staking network by value. The move comes as the broader staking market showed mixed performance, with returns and participation diverging meaningfully across major chains.
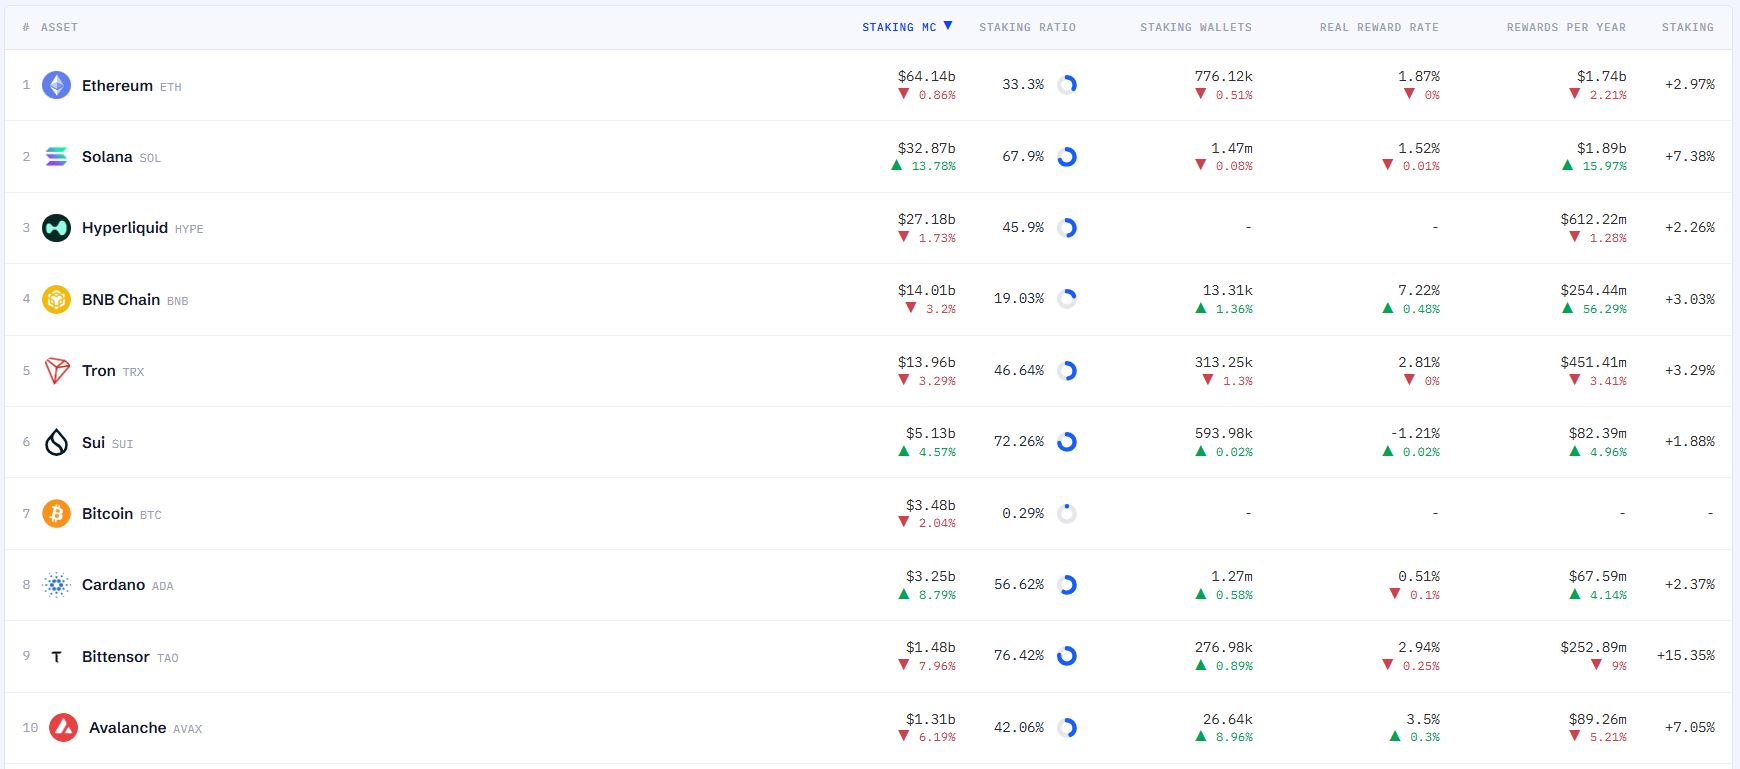
According to data compiled by StakingRewards at 2:45 a.m. ET on June 25 (6:45 UTC), Ethereum (ETH) remained the largest staking ecosystem, with a staked market capitalization of $64.14 billion—down 0.86% from the prior week. Solana held onto second place at $32.87 billion but stood out with a 13.78% weekly increase, one of the strongest moves among top networks.
Outside the top two, Hyperliquid reported a staked market cap of $27.18 billion, slipping 1.73% over the week. BNB Chain (BNB) declined 3.2% to $14.01 billion, while Tron (TRX) fell 3.29% to $13.96 billion. Among mid-cap networks, Sui (SUI) rose 4.57% to $5.13 billion, and Cardano (ADA) increased 8.79% to $3.25 billion. In contrast, Bittensor (TAO) dropped 7.96% to $1.48 billion and Avalanche (AVAX) fell 6.19% to $1.31 billion, marking the steepest declines in this week’s snapshot.
Participation metrics painted a different picture. By staking ratio—staked supply versus circulating supply—Bittensor ranked highest at 76.42%, followed by Sui at 72.26% and Solana at 67.9%. Cardano stood at 56.62%, while Tron and Avalanche posted 46.64% and 42.06%, respectively. Solana also led in validator-participant breadth, with roughly 1.47 million staking wallets, ahead of Cardano at 1.27 million and Ethereum at 776,000. Avalanche recorded the fastest wallet growth week-over-week, up 8.96%, while Tron was the only major chain listed to see wallets decline, down 1.3%.
On ‘real yield’—a measure intended to reflect practical, net staking rewards—BNB Chain remained the highest at 7.22%. Avalanche came in at 3.5%, Bittensor at 2.94%, Tron at 2.81%, Ethereum at 1.87%, and Solana at 1.52%. Sui stayed in negative territory at -1.21%, underscoring how reward structures and token dynamics can leave nominal staking income lagging inflation or other network factors.
Estimated annual rewards, a proxy for the dollar value distributed to stakers over a year at current rates and valuations, were led by Solana at $1.89 billion, narrowly ahead of Ethereum at $1.74 billion. Hyperliquid followed with $612.22 million, then Tron at $451.41 million and Bittensor at $252.89 million. Week-over-week, BNB Chain logged the largest jump in estimated annual rewards, surging 56.29%. Solana increased 15.97%, while Sui and Cardano rose 4.96% and 4.14%. Declines were concentrated in Bittensor (-9%), Avalanche (-5.21%), Tron (-3.41%), Ethereum (-2.21%), and Hyperliquid (-1.28%).
In staking ROI terms, Bittensor posted the highest annualized ROI at 15.35%, followed by Solana at 7.38% and Avalanche at 7.05%. BNB Chain showed 3.03%, while Tron and Ethereum were near 3.29% and 2.97%, respectively. Sui, Cardano, and Hyperliquid registered 1.88%, 2.37%, and 2.26%.
However, when price performance is combined with staking rewards to calculate a 365-day total ROI, results skewed sharply. Hyperliquid led with 71.1%, and Tron was the only other network in the list to remain positive at 16.9%. Most others were negative over the same period, with Sui (-72.89%), Cardano (-71.15%), and Avalanche (-58.5%) among the weakest—highlighting that staking income often cannot offset sustained token drawdowns in bearish or volatile markets.
Overall, the week’s data suggests capital is selectively rotating toward a few large networks—most notably Solana—while reward dynamics, participation, and longer-term performance remain uneven. For market participants, the figures illustrate how ‘staking yield’ varies not just by protocol design, but also by token price cycles and the depth of on-chain participation.


Comment 0