 News
News  Coin Information
  About us
  Customer Service


Bitcoin (BTC) started the second week of April on the back foot, slipping into negative territory after last week’s rebound and underscoring how far 2026 has fallen short of typical seasonal expectations. While the declines have been modest so far, the market’s inability to sustain upside momentum is keeping investors focused on whether this month can deliver the historically strong performance April is known for.
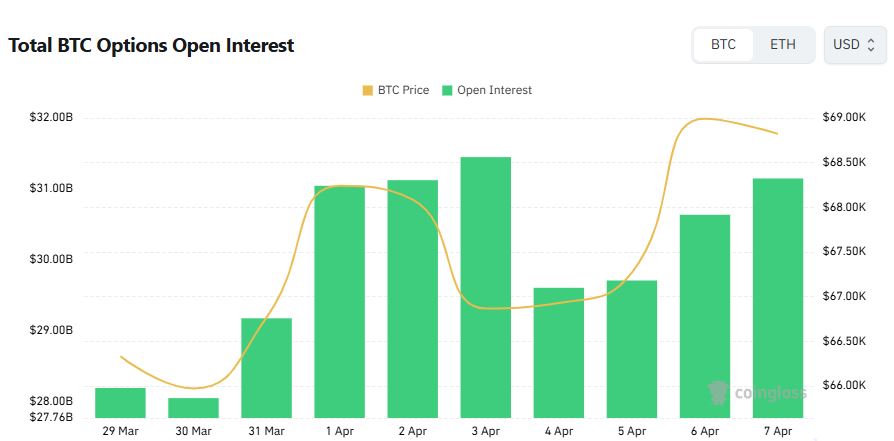
As of Tuesday 1:35 p.m. KST (Tuesday 12:35 a.m. ET), data from CoinGlass showed BTC down 0.63% for the week so far, marking a return to a soft, range-bound tone following a 4.5% weekly gain last week. On a daily basis, Bitcoin was down 0.16% at the time of the snapshot, extending a two-day losing streak after Monday’s 0.24% dip.
Even so, the current weekly performance looks comparatively resilient against historical benchmarks for the same calendar week. CoinGlass data cited an average return of -3.67% and a median return of -0.28% for the comparable week in past cycles, suggesting that this week’s pullback remains within a relatively contained band despite broader caution in risk assets.
April’s early returns have been notably underwhelming relative to long-term patterns. Month-to-date, BTC is up only 0.49%, well below April’s historical average gain of 12.17% and the median of 5.04%. April has not been uniformly bullish—Bitcoin has finished the month lower in five out of 13 recorded instances—but the gap between current performance and historical norms is still drawing attention amid hopes that the second quarter could revive momentum.
The subdued start comes after a prolonged stretch of monthly weakness. Bitcoin recorded five consecutive monthly declines from October through February, with February closing down 14.94%. March offered a partial reversal, finishing up 1.81%, but early April trading suggests the market has yet to establish a convincing trend, with buyers appearing selective and rallies fading quickly.
Because April is also the first month of the second quarter, quarter-to-date performance mirrors the monthly figure at 0.49%. That compares poorly to the historical second-quarter average return of 25.21% and a median return of 7.38%, reinforcing the sense that BTC is tracking behind typical cycle behavior. Historical first-quarter outcomes, as cited in the data, show eight positive quarters versus five negative ones across 13 observations, highlighting that quarterly seasonality has been mixed rather than deterministic.
On a longer horizon, yearly performance data compiled by StatMuse shows how sharply Bitcoin’s profile can swing between boom and bust: -64.3% in 2022, 155.4% in 2023, 121% in 2024, and -6.3% in 2025. For 2026, Bitcoin is down 21.3% year-to-date, narrowing slightly from last week’s -24.6% as losses have been partially retraced.
Market pricing reflected the same cautious tone. According to TokenPost Market at Tuesday 1:35 p.m. KST (Tuesday 12:35 a.m. ET), Bitcoin traded at $68,753, down 0.45% from the prior day.
The latest figures reinforce a familiar dynamic for Bitcoin: strong long-term returns alongside pronounced short-term volatility and recurring seasonal narratives that do not always play out on schedule. With April’s historical track record setting a high bar, the coming weeks will matter for whether BTC can reclaim momentum in an environment that has so far favored patience over risk-taking.


Comment 0