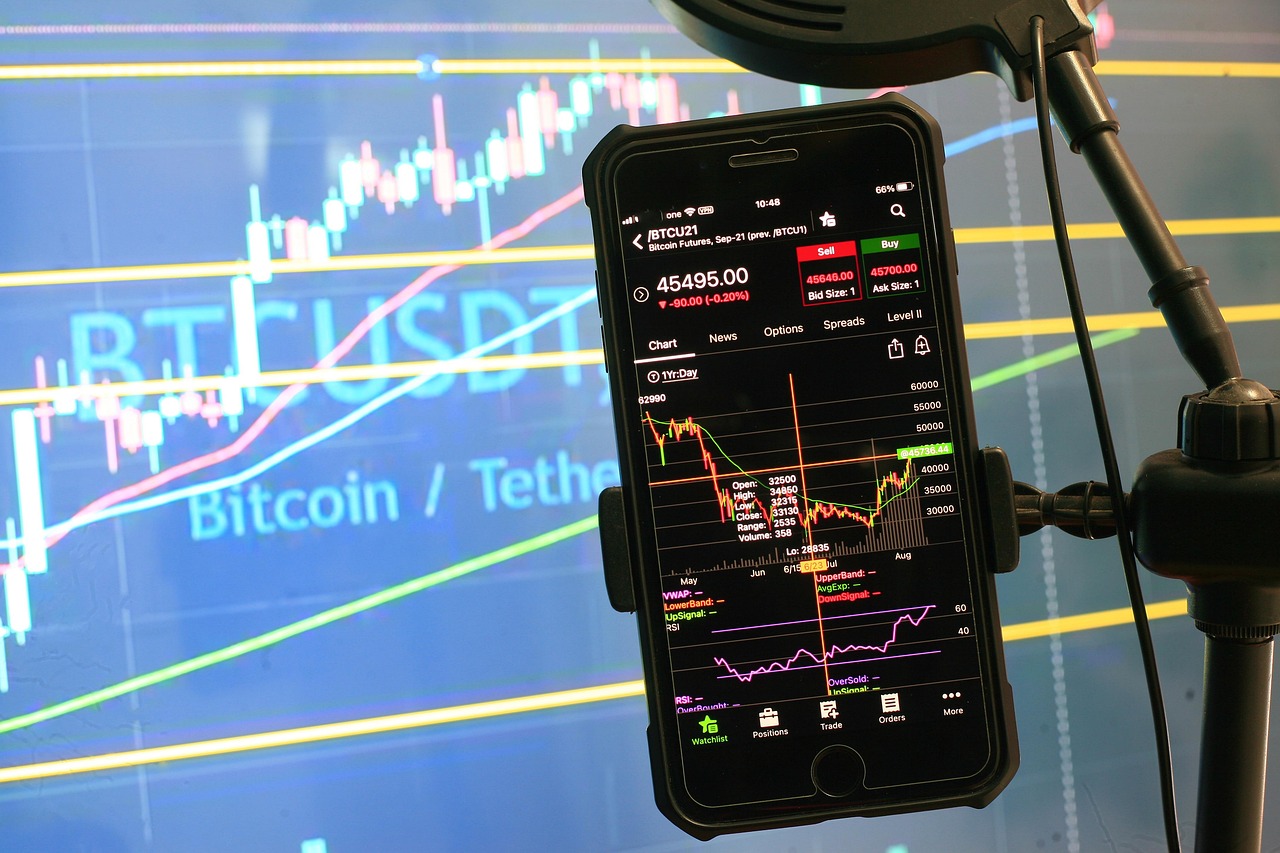
Following a noteworthy recovery after its recent halving, Bitcoin has sparked anticipation among investors, suggesting a potential upward trend for altcoins such as BNB, NEAR, MNT, and RNDR. The cryptocurrency's resilience could signal a broader bullish movement in the digital asset sector.
Bitcoin ETFs Attract Steady Inflows; Analysts Predict Continued Investment Growth Through 2024
Bitcoin has recovered strongly from intra-week lows and is expected to end the halving week with a slight loss of around 1%. According to Farside Investor's statistics (via Cointelegraph), the spot Bitcoin exchange-traded funds had a $30.4 million inflow the day before the halving, ending five consecutive days of outflows.
The Grayscale Bitcoin Trust (GBTC) has seen the majority of outflows, while BlackRock's iShares Bitcoin Trust (IBIT) has consistently attracted investments. In an X post, Bloomberg Intelligence ETF analyst Eric Balchunas stated that the IBIT had seen "69 days of straight inflows."
Inflows into Bitcoin ETFs are expected to increase steadily in 2024. Bitwise CEO Hunter Horsley expects many asset management firms to buy Bitcoin ETFs by the end of 2024. He stated that the firms were "long only" and would be "an amazing new constituent in the Bitcoin space."
Bitcoin Price Analysis
Bitcoin's recovery has reached the 20-day exponential moving average ($65,850), an important mark to monitor.
If the price falls sharply from the moving averages, it indicates that bears are selling on rallies. This might lead to a retest of the $60,775–$59,600 support zone. Buyers will likely defend this zone with all their might, as a collapse might exacerbate selling. The BTC/USDT pair may fall to $54,298, a 61.8% Fibonacci retracement.
If the price breaks above the moving averages, the pair may fluctuate between $60,775 and $73,777. Bulls must push the price above the overhead barrier to allow for a rally above $84,000.
On the 4-hour chart, the moving averages completed a bullish crossover, indicating that the bulls have the upper hand in the short term. The duo could encounter resistance between $67,000 and $68,000, but the next halt could be $71,000 if this zone is overcome.
This hopeful outlook will be undermined if the price falls and breaks below the moving averages. That could indicate aggressive selling during rallies. The duo may drop to $63,000 and then to $60,775.
Binance Coin Price Analysis
Binance Coin has been trading between $495 and $635 for the last few days, indicating that supply and demand are in balance.
Buyers drove the price above the moving averages on April 20, signaling that selling pressure is easing. The BNB/USDT pair may approach overhead resistance at $635, where bears are expected to sell aggressively. The range-bound activity could last much longer if the price falls drastically from $635.
The next trending move will start with a break above $635 or below $495. If the $635 mark is breached, the pair may begin its journey towards $692. On the downside, a drop below $495 may send the pair to $460.
The 20-EMA has begun to appear on the 4-hour chart, and the RSI is in the positive zone, indicating that bulls are attempting a return. There is minimal support at $585, but if this level is breached, the pair might hit $600 and then $635. The Bears are anticipated to make a strong defense of around $635.
If the price falls below the moving averages, the positive perspective will be invalid soon. The pair may then fall to $540 and eventually to $510.
Near Protocol Price Analysis
Near Protocol has fallen within a descending channel pattern, indicating that the trend favors bears.
However, the recovery above the 20-day EMA ($6.15) indicates that selling pressure may be easing immediately. The NEAR/USDT pair will attempt a climb to the resistance line, where bears are expected to sell strongly. If the price drops sharply from the resistance line, it indicates that the pair may remain within the channel.
Buyers must push the pair above the channel if they wish to gain an advantage. This will indicate a short-term trend change, and the pair might rally to $8 and then $9.
After a prolonged struggle, the pair broke above $5.90, indicating that bulls had a tiny advantage. The price may fall and retest $5.90, but if bulls convert this level into support, the pair may approach the resistance line.
Alternatively, if the price falls swiftly and breaks below the moving averages, it could indicate that the breakout above $5.90 was a bull trap. This might drive the price down below $5 and, eventually, to the channel's support.
Mantle Price Analysis
Mantle (MNT) broke out of the 20-day EMA ($1.18) on April 20 after trading between the moving averages for several days. This shows that bulls are attempting to take control.
However, the lengthy wick on the April 21 candlestick indicates that the bears have not given up and aim to bring the price back below the 20-day EMA. If they do, it may trap the aggressive bulls and cause the price to fall to the 50-day SMA ($1.09). A breach below this level might take the MNT/USDT pair to $1.
On the contrary, if the price remains above the 20-day EMA, the bulls are defending this level. The pair may then move to the 61.8% Fibonacci retracement level of $1.32, and if this level is achieved, the next target may be $1.51.
Bulls have pushed the price above the symmetrical triangle formation, implying that the correction may be over. If the price bounces off the 20-EMA, it raises the prospect of a surge over $1.25. The pair may then increase to $1.32.
Meanwhile, the bears are likely to have different plans. They'll try to pull the price back into the triangle. That may imprison the bulls, and a break below the triangle will shift the bear's advantage. The pair may then drop to $1.
Render Price Analysis
Render (RNDR) has been in a corrective phase for several days, but bulls are attempting to make a comeback by pushing the price above the downward trend line.
The 20-day EMA ($8.90) has flattened out, and the RSI has risen to its midway, indicating that the bears are losing control. If the price remains above the 20-day EMA, the RNDR/USDT pair will likely advance to the 50-day SMA ($9.95) and then to $12.
Instead, if the price falls and remains below the 20-day EMA, it may indicate that the breakout was a false move. The bears will then attempt to lower the price to $7 and then to $6.
The moving averages have completed a bullish crossover, indicating an advantage for buyers. However, the bears may represent a significant challenge around $9.50. If the price declines from the overhead resistance but finds support at the 20-EMA, it indicates a shift in mood from selling rallies to buying dips. That improves the chances of a rally to $10.50.
Unlike this assumption, a break and closing below the moving averages will indicate that the recent breakout was a bull trap. The pair may then drop to $7.
Photo: Microsoft Bing


Comment 0