 News
News  Coin Information
  About us
  Customer Service


ETH/USD chart - Trading View
Exchange - Coinbase
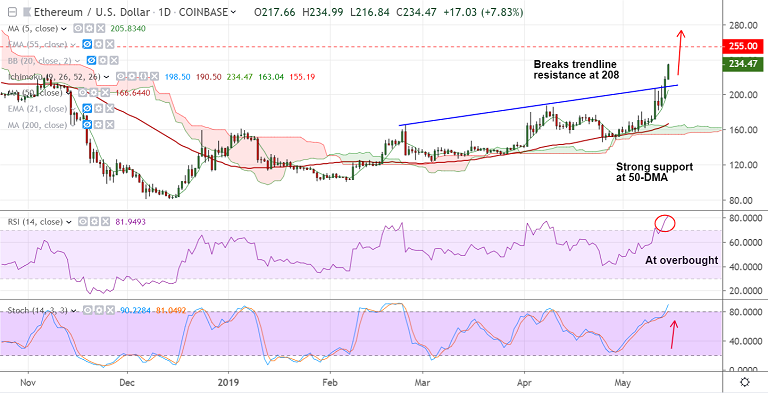
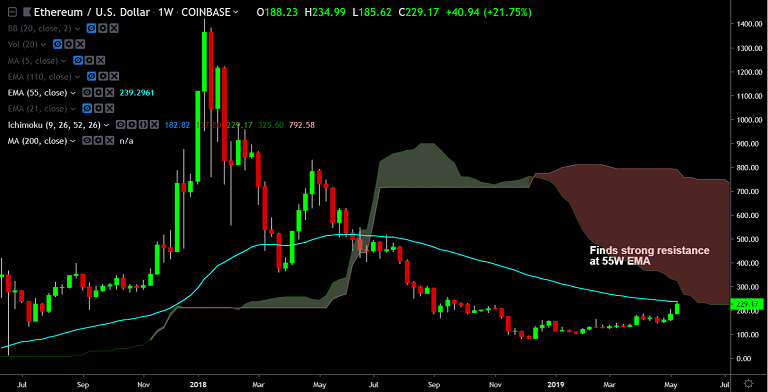
Support: 204.98 (5-DMA); Resistance: 239.30 (55W EMA)
Technical Analysis: Bias Bullish
ETH/USD is riding the bull wave, hits 8-month highs at 234.99
The pair has broken above trendline resistance at 208, bias bullish
Stochs and RSI are sharply higher and MACD and DMI support gains
That said, oscillators are at overbought levels which could see some correction from highs
55W EMA at 239 offers strong resistance, breakout above required for further upside
5-DMA at 205.83 is immediate support below trendline, break below to see dip till 50-DMA
For details on FxWirePro's Currency Strength Index, visit http://www.fxwirepro.com/currencyindex.


Comment 0