 News
News  Coin Information
  About us
  Customer Service


Solana (SOL) extended its pullback on Monday, sliding to $85.85 as of 9:00 a.m. UTC on March 23, marking a 1.73% decline over the past 24 hours. The token is now down 7.5% on the week, underscoring how quickly risk appetite has cooled across major altcoins as broader market conditions remain fragile.
The move keeps Solana in a persistent correction that has weighed on the asset for much of the past two months. Over the last 60 days, SOL has fallen 33.79%, even as shorter timeframes show mixed signals—modest gains over the past 30 days contrast with a 90-day drop of 30.85%. With a market capitalization of roughly $49.1 billion, Solana remains the seventh-largest cryptocurrency, accounting for about 2.09% of total crypto market value.
Despite the price weakness, trading activity picked up. Spot volume over the past 24 hours reached approximately $2.76 billion, up 7.89% from the previous day, a sign that 'liquidity' is returning as traders reposition. The bulk of transactions occurred on centralized exchanges (CEXs), while decentralized exchange (DEX) turnover was negligible by comparison, highlighting that most short-term price discovery is still being driven by venue-heavy flows rather than on-chain swapping activity.
Intraday metrics also point to incremental selling pressure. Solana’s hourly change was reported at -0.22%, suggesting that dips are being sold rather than bought aggressively, at least in the near term. Market participants are increasingly focused on whether the $85 area can hold as a technical support zone after multiple weeks of lower highs.
Supply dynamics remain a key part of the Solana narrative. Circulating supply was estimated at about 572.13 million SOL, with total supply around 622.93 million SOL. Because Solana uses an inflationary token model without a hard maximum supply, its fully diluted valuation (FDV) was pegged near $53.4 billion based on current pricing. For investors, that structure means future issuance and staking emissions remain relevant variables when assessing long-term dilution and valuation.
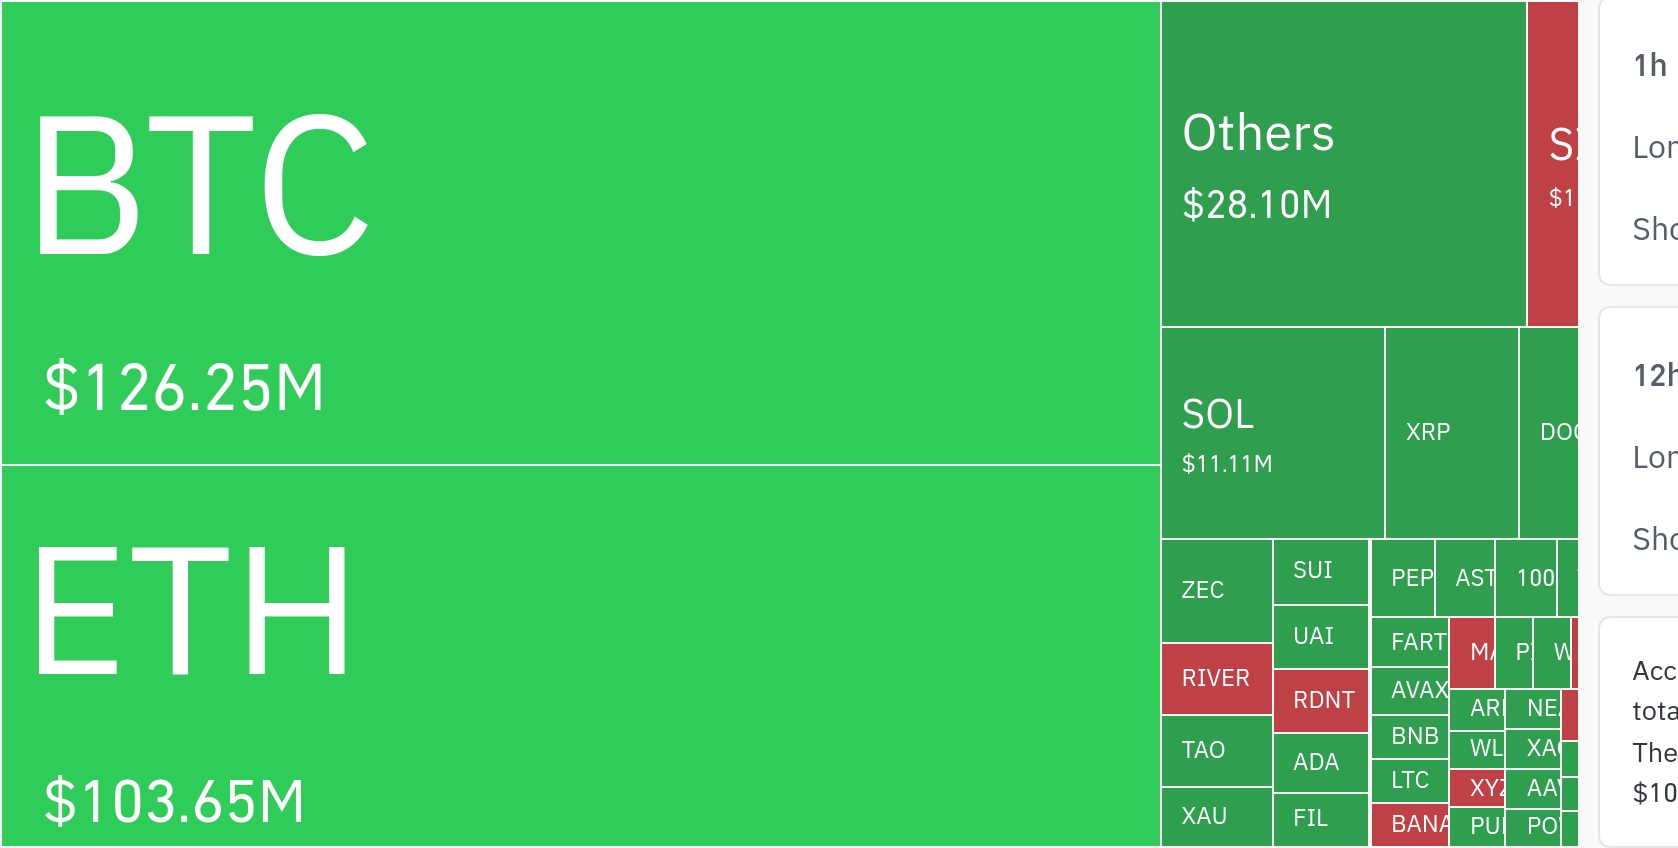
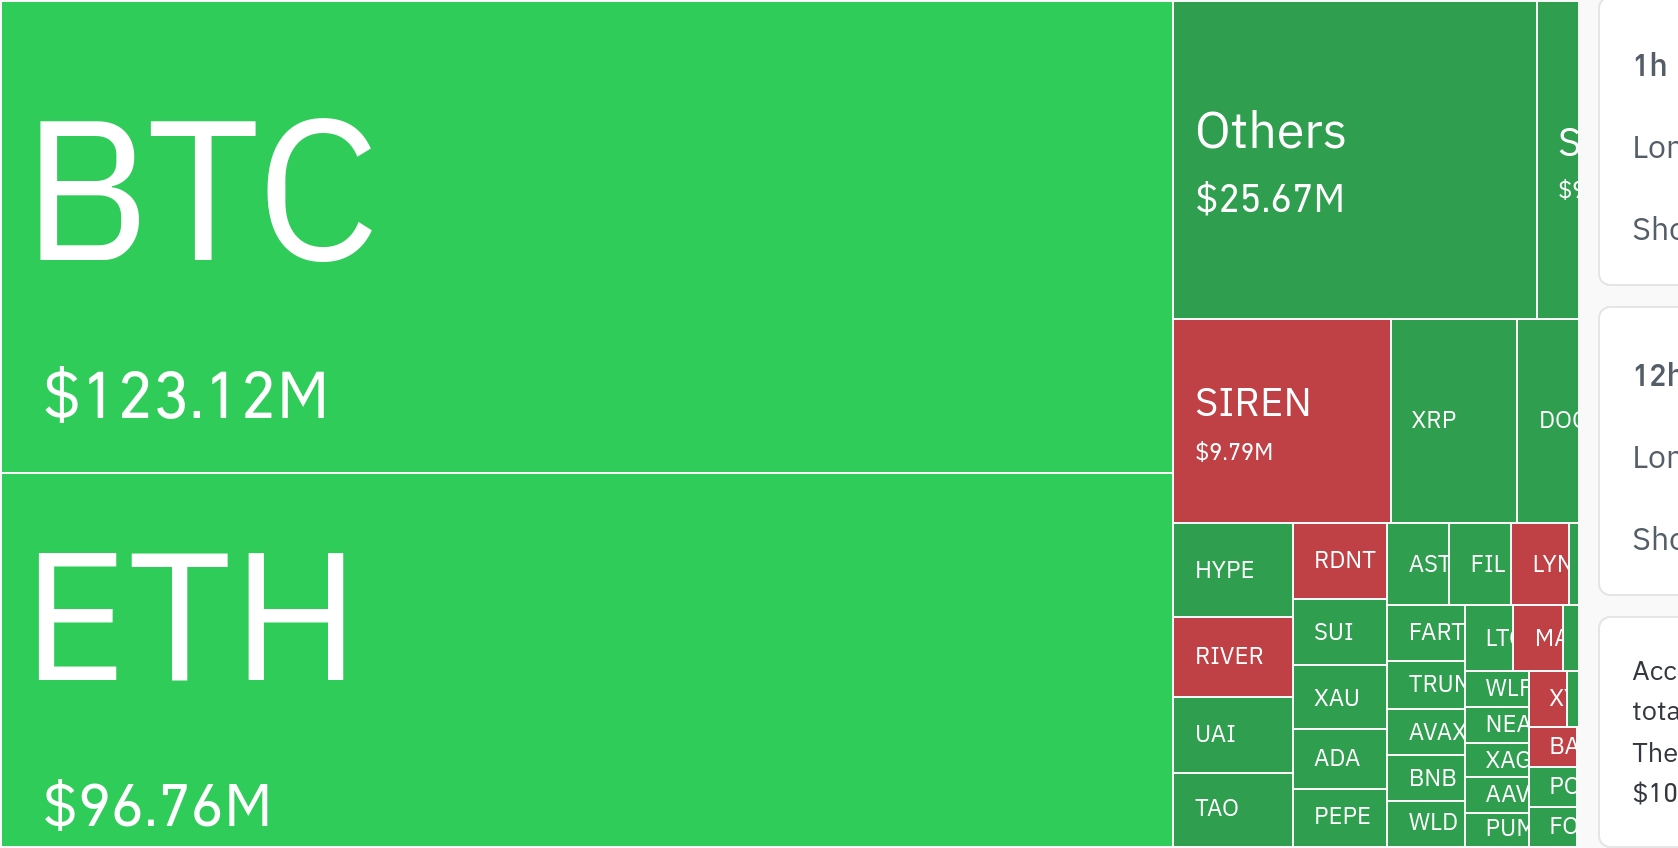
The correction in SOL broadly mirrors the softer tone seen in Bitcoin (BTC) and Ethereum (ETH), as crypto markets continue to trade like high-beta risk assets that are sensitive to macro signals. Analysts tracking cross-asset correlations say near-term direction is likely to be shaped less by Solana-specific news and more by external drivers such as Bitcoin’s trend and equity-market benchmarks like the Nasdaq.
Macro catalysts remain front and center, particularly expectations around U.S. Federal Reserve policy and the regulatory outlook for digital assets. Shifts in interest-rate pricing and enforcement posture tend to ripple quickly through altcoin markets, where positioning can turn quickly as leverage and sentiment reset.
On the network side, Solana has long marketed itself as a high-performance layer-1 blockchain, and it has spent the post-FTX period emphasizing ecosystem resilience and continuity. However, fresh ecosystem catalysts appeared limited in the latest reporting window, with no major protocol announcements or high-profile project launches cited as immediate momentum drivers.
Separately, figures related to circulating supply showed minor discrepancies across data sources. Solana’s self-reported circulating amount was listed at roughly 525.23 million SOL—about 8% below the commonly referenced circulating figure—translating to a self-reported market cap near $45.0 billion. Observers attribute such gaps largely to differences in how staking and locked tokens are classified and counted.
Because Solana runs a proof-of-stake (PoS) system, a significant portion of the supply is typically staked, a factor that can reduce immediate sell pressure. At the same time, heavy staking can also contribute to 'liquidity constraints,' which may amplify short-term volatility when large flows hit the market.
Looking ahead, traders are watching whether SOL can defend the mid-$80s and stabilize within an $80–$90 range as volumes rise. A clearer shift in macro conditions—or a meaningful ecosystem catalyst—could help revive upside momentum, but for now Solana’s price action continues to reflect a market searching for direction.
🔎 Market Interpretation
- Downtrend intact: SOL slid to $85.85 (-1.73% 24h), extending a broader correction (about -7.5% weekly, -33.79% over 60 days), signaling continued risk-off behavior in altcoins.
- Support in focus: The $85 area is being watched as a key technical support zone after weeks of lower highs; hourly performance (-0.22%) suggests sellers are still active on dips.
- Volume rising despite weakness: Spot volume jumped to roughly $2.76B (+7.89% day/day), implying active repositioning rather than capitulation, with price discovery still dominated by centralized exchanges.
- Macro-led regime: SOL’s near-term direction is framed as more dependent on BTC trend and macro proxies like the Nasdaq than Solana-specific news, reinforcing its “high-beta” behavior.
- Tokenomics matter for valuation: Solana’s inflationary supply model (no hard max) keeps attention on emissions/dilution; FDV was estimated near $53.4B at current prices.
💡 Strategic Points
- Key range to monitor: Traders are centered on whether SOL can stabilize in the $80–$90 band; a break below the mid-$80s could invite further momentum selling, while holding may encourage range trading.
- Confirm strength via structure: A higher-probability bullish shift would typically require higher lows and/or reclaiming prior resistance levels; current conditions still indicate a corrective structure.
- Watch venue flow signals: With CEXs driving most turnover and DEX activity comparatively small, near-term moves may be more sensitive to order-book liquidity, leverage resets, and large centralized flows.
- Track supply and staking dynamics: High staking can reduce immediate circulating liquidity (potentially dampening steady sell pressure) but can also amplify volatility if large unstaking/sell waves occur into thin books.
- Data discrepancies as a risk factor: Circulating supply estimates differed (common estimate ~572.13M vs self-reported ~525.23M), which can affect market-cap/FDV comparisons; investors may want to verify methodology (locked vs staked vs liquid).
- Primary catalysts remain external: Fed policy expectations and regulatory posture are highlighted as the most immediate drivers; absent major ecosystem launches, SOL may continue to trade as a macro-sensitive risk asset.
📘 Glossary
- Support zone: A price area where buying interest historically appears, potentially slowing or reversing declines (here, around $85).
- Lower highs: A bearish chart pattern where each rebound peaks below the previous peak, often indicating sustained selling pressure.
- Spot volume: The value of assets traded for immediate settlement; rising spot volume can indicate stronger participation and repositioning.
- CEX (Centralized Exchange): A custodial trading venue (e.g., Binance, Coinbase) where most order-book price discovery occurs.
- DEX (Decentralized Exchange): An on-chain exchange using smart contracts; DEX volume can reflect organic on-chain demand and swapping activity.
- Liquidity: How easily an asset can be bought/sold without moving price significantly; lower liquidity often increases volatility.
- Circulating supply: Tokens considered tradable and available in the market, excluding certain locked or restricted allocations depending on methodology.
- Total supply: All tokens that currently exist (minus any burned), including potentially locked or non-circulating tokens.
- FDV (Fully Diluted Valuation): Market cap computed using total supply (or maximum supply if fixed) multiplied by current price—useful for dilution-aware valuation.
- Inflationary token model: A design where new tokens are issued over time (e.g., staking rewards), which can create long-term dilution.
- PoS (Proof-of-Stake): A consensus mechanism where validators stake tokens to secure the network and earn rewards.
- Cross-asset correlation / high-beta: Tendency for an asset to move with broader markets; high-beta assets often swing more than benchmarks during risk-on/off shifts.


Comment 0