 News
News  Coin Information
  About us
  Customer Service


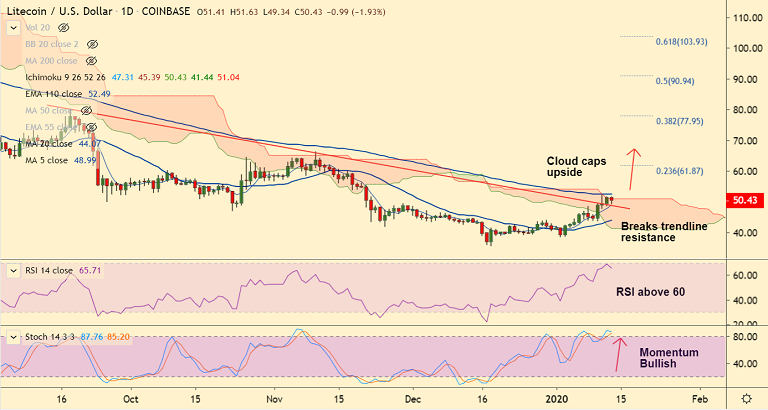
LTC/USD chart - Trading View
Exchange - Coinbase
Technical Analysis: Bias Bullish
GMMA Indicator: Major Trend - Neutral; Minor Trend - Bullish
Overbought/ Oversold Index: Overbought
Support: 48.99 (5-DMA); Resistance: 52.49 (110-EMA)
LTC/USD was trading 2.10% lower on the day at 50.39 at 11:00 GMT, bias remains bullish.
The pair has broken above falling trendline resistance and further upside in the pair was capped at daily cloud top.
Break above cloud finds next major resistance at 110-EMA at 52.49. Decisive breakout at 110-EMA to see further upside.
Technical indicators are biased higher. Volatility is rising. MACD and ADX support upside.
GMMA shows near-term trend has turned bullish with crossover of short-term MAs over long-term MAs.
Next major resistance above 110-EMA lies at 20W MA at 54.22 ahead of 21W EMA at 56.18.
5-DMA is immediate support at 48.98. Failure at 110-EMA and retrace below 21-EMA negates any bullish bias.


Comment 16