 News
News  Coin Information
  About us
  Customer Service


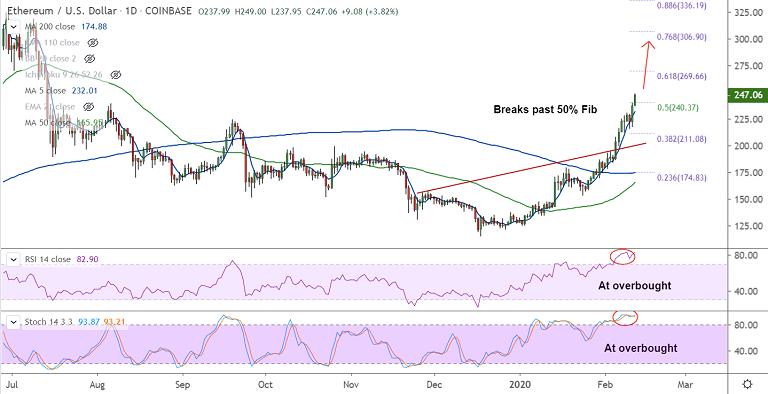
ETH/USD chart - Trading View
Exchange - Coinbase
Technical Analysis: Bias Bullish
GMMA Indicator: Major Trend - Bullish; Minor Trend - Bullish
Overbought/ Oversold Index: Overbought
Volatility: High and Rising
Support: 240.37 (50% Fib); Resistance: 269.66 (61.8% Fib)
ETH/USD surges higher on the day, trades 3.79% higher at 247 at around 05:55 GMT.
The pair has broken past 50% Fib retracement at 240.37 and is on track for further upside.
Volatility is rising both on the daily and weekly charts. Major and minor trend are bullish.
Oscillators are at highly overbought levels which may cause some corrections, but no major signs of reversal seen.
Next hurdle on the upside aligns at weekly cloud top at 255.98 ahead of 61.8% Fib at 269.66.
5-DMA is immediate support at 232.10, break below could see drag till 200H MA at 215.14.


Comment 0