 News
News  Coin Information
  About us
  Customer Service


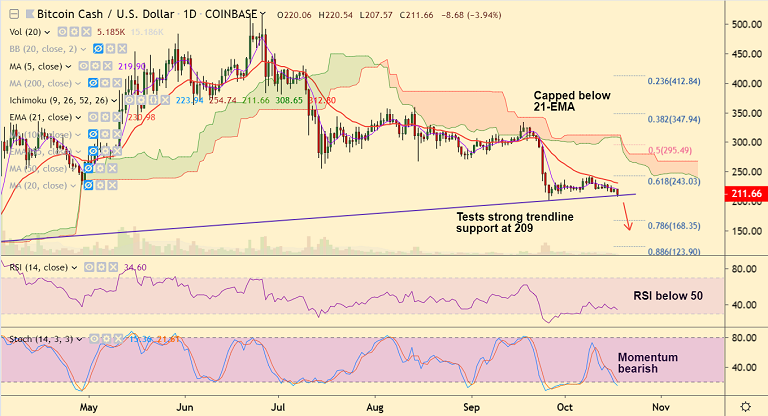
BCH/USD chart - Trading View
Exchange - Coinbase
Support: 209 (Trendline); Resistance: 230.98 (21-EMA)
Technical Analysis: Bias Bearish
Bitcoin cash (BCH) dives around 5% on the day to hit fresh monthly lows at 207.57.
BCH/USD has since pared some losses and was trading at 211.07 at 10:15 GMT, bias remains bearish.
Technical studies are strongly bearish. Stochs and RSI are sharply lower, RSI is well below 50 mark.
Volatility is rising on the intraday charts. MACD is in the negative zone and ADX is ring in support of the current weakness.
Decisive break below trendline support (209) will see a dip till 78.6% Fib at 168.35. Further weakness only on break below.
Immediate resistance is at 5-DMA at 219.91. Major resistance is at 21-EMA at 230.98. Break above 21-EMA will negate near-term bearishness.


Comment 0