(Refer BTC/USD chart on Trading View)
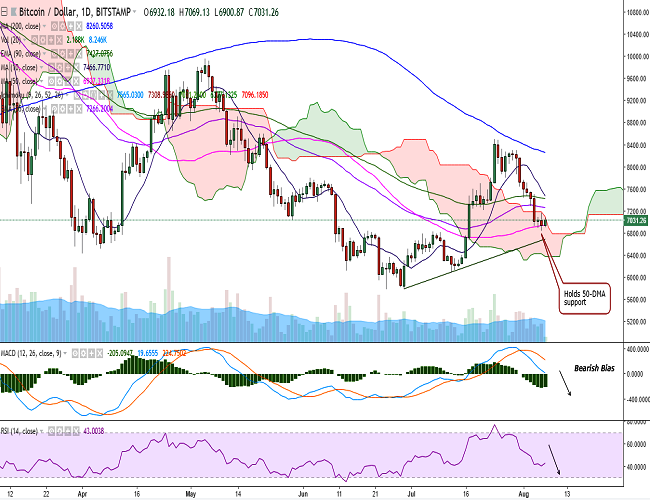
BTC/USD plunged to 6835 levels on Monday before closing just above 50-DMA at 6936 levels (Bitstamp).
The pair is currently trading at 7033 levels at the time of writing.
On the topside, a decisive break above 7096 (Cloud top) would target 7131 (1h 100-SMA)/7266 (55-EMA). Further strength would target 7316 (2h 90-EMA)/7469 (10-DMA).
On the downside, the pair is holding support at 6937 (50-DMA) and any violation would drag it to 6835 (August 6 low)/6737 (lower bollinger). Further weakness would see it testing 6666 (trend line joining 5774.72 and 6072)/6500.
Momentum Studies: Technical indicators remain bearish on the daily chart – RSI is below 50, MACD line is below the signal line and stochs in oversold zone. The pair is consolidating in a narrow range on the intraday charts.
Recommendation: Good to go short on break below 50-DMA. SL: 7500. TP: 6840/6740
<Copyright ⓒ TokenPost, unauthorized reproduction and redistribution prohibited>






Comment 1