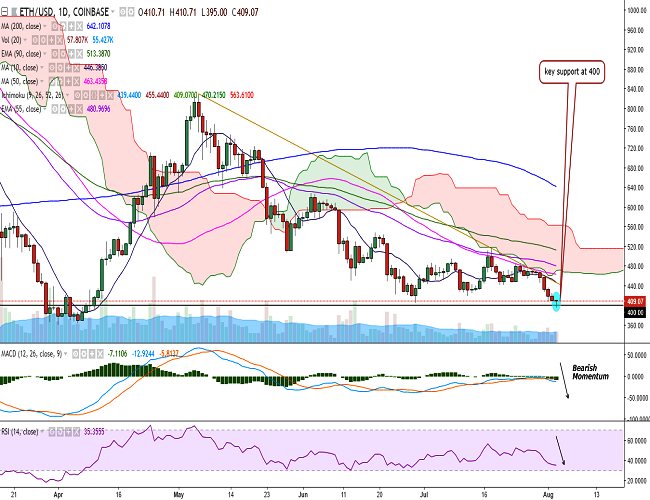
ETH/USD briefly broke below 400 levels on Friday and hit 395 levels.
The pair is currently trading at 409 levels on the daily chart with a butterfly doji formation at the time of writing.
On the upside, the pair faces resistance at 425 (5-DMA) and a break above would target 446 (10-DMA)/ 470 (cloud bottom)/500.
On the downside, the pair shopped short of 393 (127.2% retracement of 418.23) and further weakness would drag it to 361 (1w 90-EMA)/349 (113% extension of 828.97 and 404.22).
Technical indicators remain bearish on the daily chart – RSI is weak at 35, MACD line is below the signal line, and stochs are in the oversold zone. However, the butterfly doji pattern suggests bitcoin bulls are trying hard to keep the pair from falling below 400.
Call Update: We recommended staying short in our previous call. The pair has hit TP1.
Recommendation: Book partial profits, stay short. Trail SL to 430. TP: 390/360.
<Copyright ⓒ TokenPost, unauthorized reproduction and redistribution prohibited>




Comment 1