ETH/USD chart - Trading View
Exchange - Coinbase
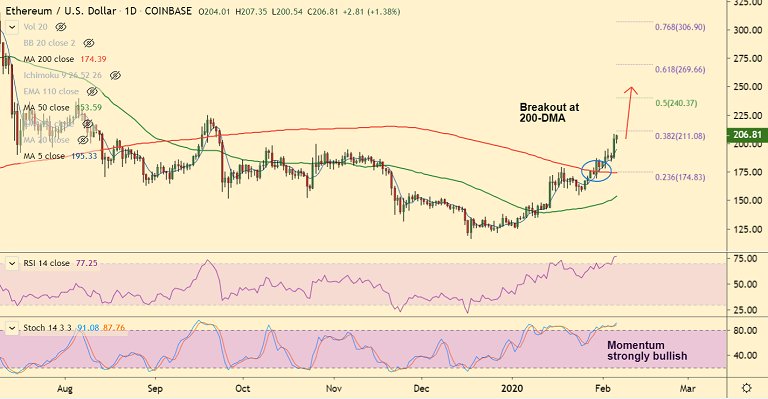
Technical Analysis: Bias Bullish
GMMA Indicator: Major Trend - Bullish; Minor Trend - Bullish
Overbought/ Oversold Index: Highly Overbought
Volatility: High and Rising
Support: 195.11 (5-DMA); Resistance: 211.08 (38.2% Fib)
ETH/USD is extending previous session's gains, bias is strongly bullish. Long-term uptrend in the forming.
The pair was trading 0.98% higher on the day at 206 at around 06:30 GMT, after closing 8.37% higher in the previous session.
Momentum studies are bullish, Stochs and RSI are biased higher. MACD and ADX supports gains.
Volatility is rising as evidenced by rising Bollinger bands. Price action is above major moving averages.
Major trend in the pair has turned bullish. 200-DMA breakout adds support to the uptrend.
Price action has broken 55W EMA resistance at 197.74. Gains till 61.8% Fib at 269.66 likely.
Next major hurdle lies at at 38.2% Fib at 211.08 ahead of weekly cloud at 222.55.
Overbought oscillators may result in minor correction. Retrace below 200-DMA may dent near-term uptrend.







Comment 0