LTC/USD chart - Trading View
Exchange - Coinbase
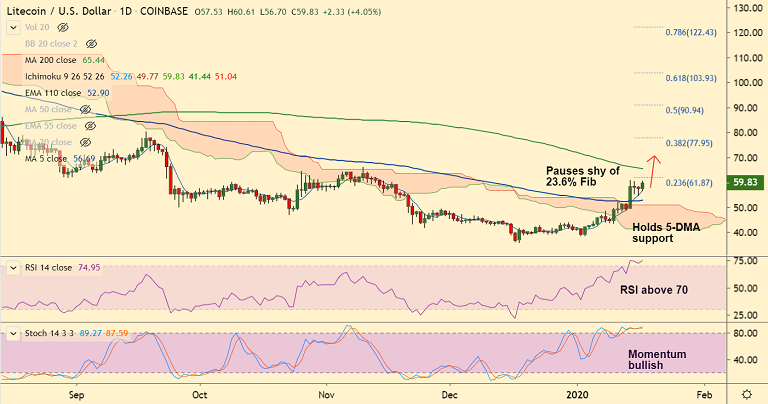
Technical Analysis: Bias Bullish
GMMA Indicator: Major Trend - Turning slightly bullish; Minor Trend - Bullish
Overbought/ Oversold Index: Overbought
Volatility: High and rising (Bollibger Bands widen)
Support: 56.66 (5-DMA); Resistance: 61.87 (23.6% Fib)
LTC/USD has bounced off 5-DMA support with a 'Hammer' formation in the previous session.
The pair was trading 3.90% higher at 59.74 at around 06:30 GMT, bias remains bullish.
Technical studies support further gains in the pair. Price action has broken out of daily cloud.
Momentum studies are strongly bullish and volatility is high and rising. MACD and ADX support uptrend.
Upside in the pair pauses shy of 23.6% Fib at 61.87. Break above targets next major hurdle at 200-DMA at 65.43.
Break below 5-DMA support will see dip till 110-EMA at 52.89. Breach at 110-EMA negates near-term bullish bias.








Comment 0