BTG/USD chart - Trading View
Exchange - Bitfinex
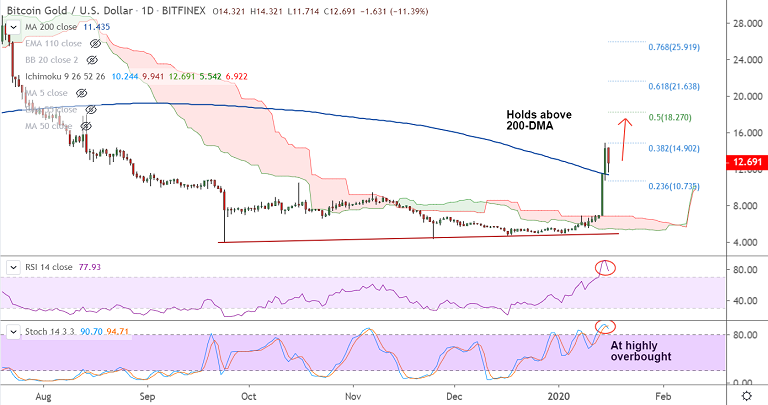
Technical Analysis: Bias Bullish
GMMA Indicator: Major Trend - Bullish; Minor Trend - Bullish
Overbought/ Oversold Index: Highly overbought
Volatility: High
Support: 11.438 (200-DMA); Resistance: 14.902 (38.2% Fib)
BTG/USD was trading 10.75% lower on the day at 12.782 at around 06:20 GMT, after closing 25.54% higher in the previous session.
The pair has paused gains shy of 38.2% Fib at 14.902, bias remains bullish.
Technical indicators are strongly bullish. Major and minor trend have turned bullish as evidenced by GMMA.
Price action has edged above the upper Bollinger band and oscillators are at overbought, raising scope for correction.
That said, pullback in price has held above 200-DMA (11.438), weakness only on retrace below. Break below 200-DMA could see dip till 110-EMA at 7.985.
On the otherside, resumption of upside momentum will see next major hurdle at 55W EMA at 20.907 ahead of 61.8% Fib at 21.638.


















Comment 0