BTC/USD chart - Trading View
Exchange - Coinbase
Technical Analysis: Bias Bullish
GMMA Indicator: Major Trend - Turning slightly bullish; Minor Trend - Strongly Bullish
Overbought/ Oversold Index: Overbought
Volatility: High and rising
Support: 8185 (23.6% Fib); Resistance: 8565 (Trendline)
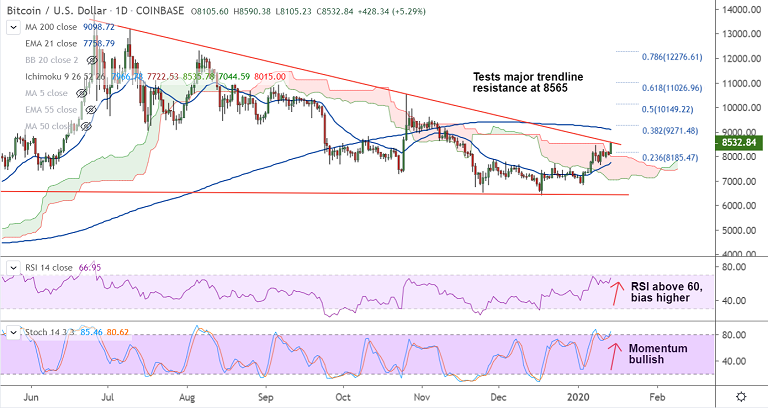
BTC/USD soared over 4 percent in early Asian trade as bulls in Bitcoin return to action. The pair was trading 5.42% higher on the day at 8543 at around 04:15 GMT. Price action is seen testing major trendline resistance at 8565.
Technical indicators are biased higher. RSI being above 60 and biased higher shows strength in the current uptrend. Stochs are in overbought territory but show bullish momentum. The pair is pivotal at major trendline resistance at 8565.
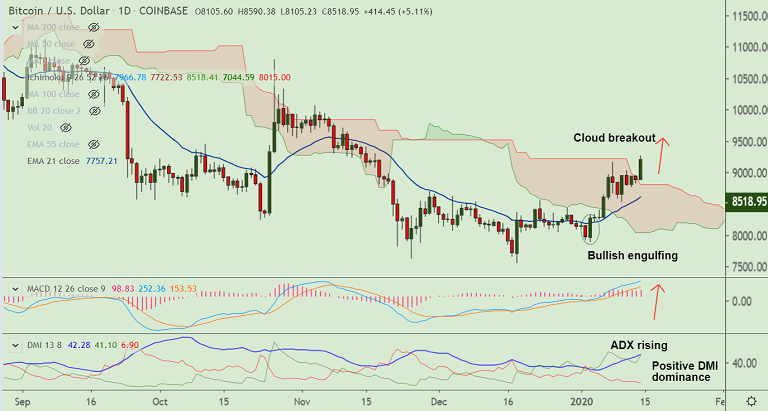
Price action has broken above daily cloud which was capping upside from the past few sessions. The positive DMI dominance and rising ADX add more support to the current uptrend, raising scope for further upside.
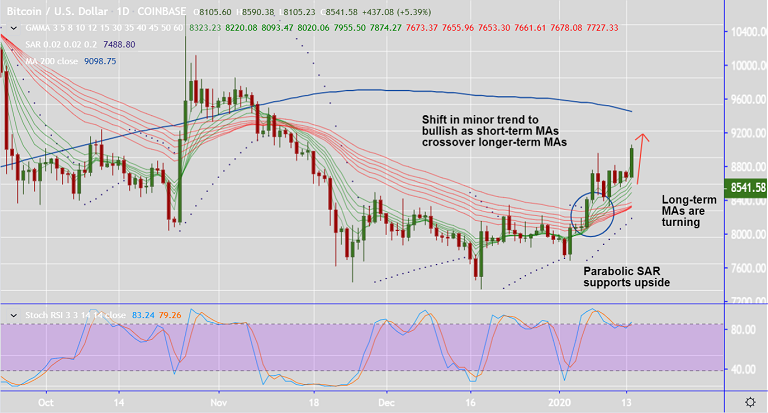
GMMA is showing a turn in the major trend with constriction and turn in the long-term moving averages. The near-term trend has turned strongly bullish with crossover of the short-term moving averages over the long-term moving averages. Parabolic SAR also supports upside.
Decisive break above trendline resistance at 8565 eyes next major hurdle at 200-DMA at 9098. 200-DMA breakout will confirm major trend reversal for the pair.







Comment 2