 News
News  Coin Information
  About us
  Customer Service


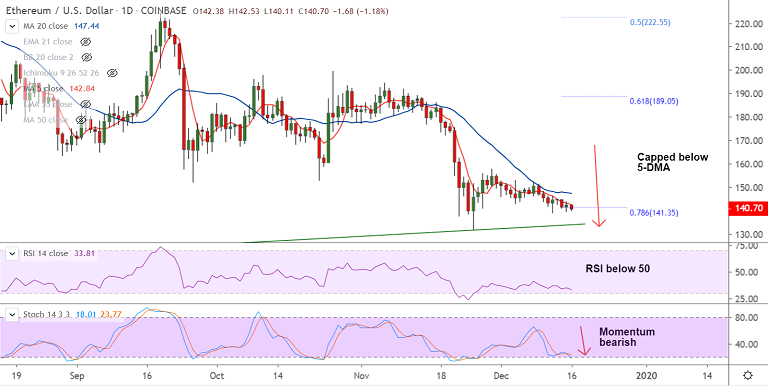
ETH/USD chart - Trading View
Exchange - Coinbase
Support: 133.50 (Trendline); Resistance: 142.84 (5-DMA)
Technical Analysis: Bias Bearish
ETH/USD is extending weakness on the day, bears largely ignore 'Spinning Top' formation on the previous day's candle.
The pair was trading 1.05% lower at 140.88 at 08:50 GMT, after closing 0.46% higher in the previous session.
Upside remains capped at 5-DMA, technical indicators are biased lower, momentum with the bears.
Stochs are sharply lower, RSI is well below 50 mark. MACD in deep negative territory adds to the bearish bias.
Bearish technical indicators with rising volatility to plummet prices. Dip till trendline support at 133.50 likely.
Stiff resistance lies at at 200H MA at 145. Break above will see a shift near-term dynamics.


Comment 0