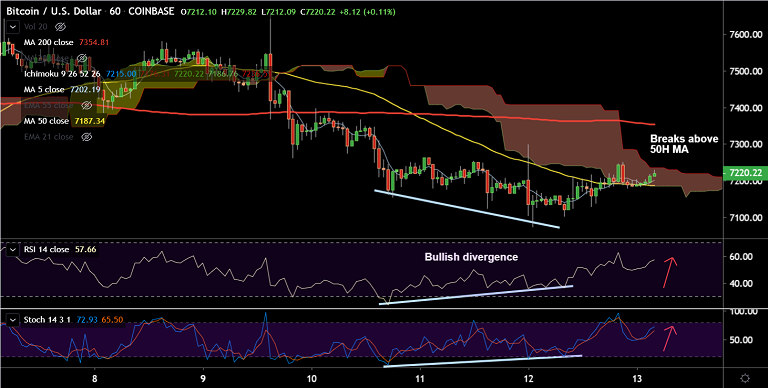
BTC/USD chart - Trading View
Exchange - Coinbase
Support: 7187 (50H MA); Resistance: 7354 (200H MA)
Technical Analysis: Bias Neutral
BTC/USD was trading in the green after successive 'Doji' formations on the daily candles in the previous 2 sessions.
The pair was trading 0.48% higher on the day at 7220 at 04:30 GMT after closing largely unchanged in the previous session.
Price action has broken above 50H MA and cloud on the hourly charts. Technical studies on the intraday charts are biased higher.
Further, 'Bullish Divergence' on RSI and Stochs on the hourly charts keeps scope for further gains.
200H MA is strong resistance at 7354. Break above 21-EMA required for bullish continuation.


Comment 0