NEO/USD chart - Trading View
Exchange - Bitfinex
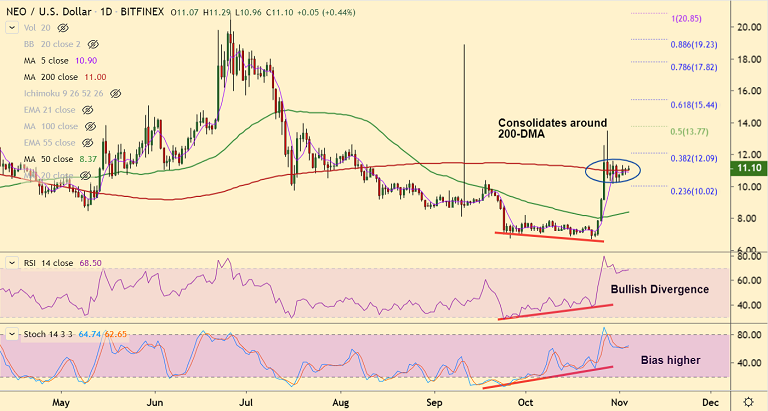
Support: 11.00 (200-DMA); Resistance: 12.09 (38.2% Fib)
Technical Analysis: Bias turning bullish
NEO/USD has been consolidating around 200-DMA from the past few sessions.
Price action has shown a break above 21W EMA. 'Bullish divergence' on the daily charts keeps scope for upside.
However, 'Spinning Top' formation on the previous week's candle dents upside. Decisive break above 200-DMA will see upside resumption.
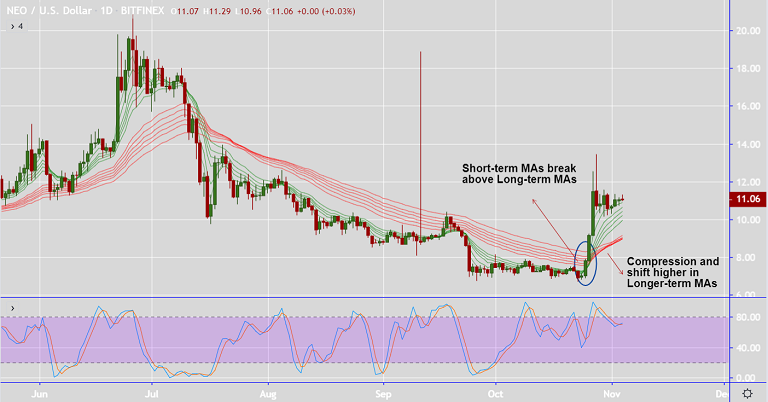
Minor trend has shifted to bullish as shown by breakout of the near-term MAs above longer-term MAs in the GMMA indicator.
Compression and turn in longer-term MAs in the GMMA shows gradual shift in major trend to bullish.

Major resistances align at 12.09 (38.2% Fib), 13.77 (50% Fib) and 15.83 (55W EMA).
Major supports are seen at 11.00 (200-DMA), 10.02 (23.6% Fib) and 9.55 (110-EMA).


Comment 0