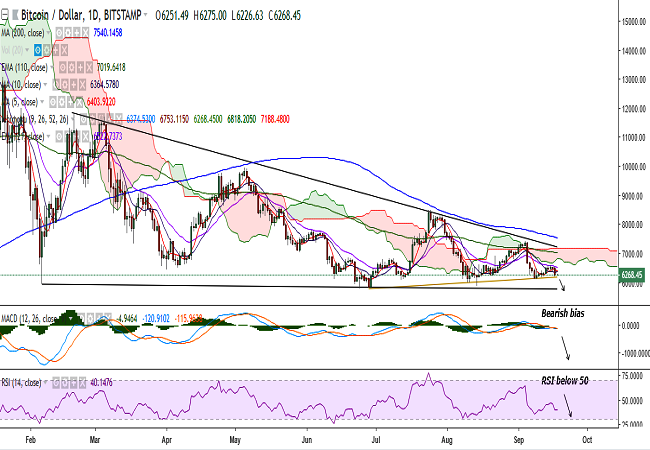
(Refer BTC/USD chart on Trading View)
BTC/USD fell to 6200 on Monday after it failed to break above 21-EMA.
The pair is extremely rangebound on Tuesday and trading at 6269 at the time of writing (Bitstamp)
On the topside, a consistent break above 6300 would see the pair testing 6364 (10-DMA)/6405 (23.6% retracement of 7411.85 and 6094.38). Further strength would test 6522 (21-EMA)/6597/6664 (50-DMA)/6700.
On the other hand, the pair has found support near 6196 (trend line joining 5774.72 and 5995.75) and any violation would drag it to 6094 (September 09 low)/6000. Further weakness would see it testing 5920 (February 06 low)/5900.
Bias appears bearish on the daily chart with stochs near oversold levels, RSI below 50, and MACD line below the signal line. The pair has formed a descending triangle pattern on the daily chart.
Intraday bias also appears weak. On the 4h chart, the death cross and bearish crossover of 100-SMA and 200-SMA suggest further downside could be on the cards.
Recommendation: Good to go short on break below 6200. SL: 6410. TP: 6100/6000.







Comment 0