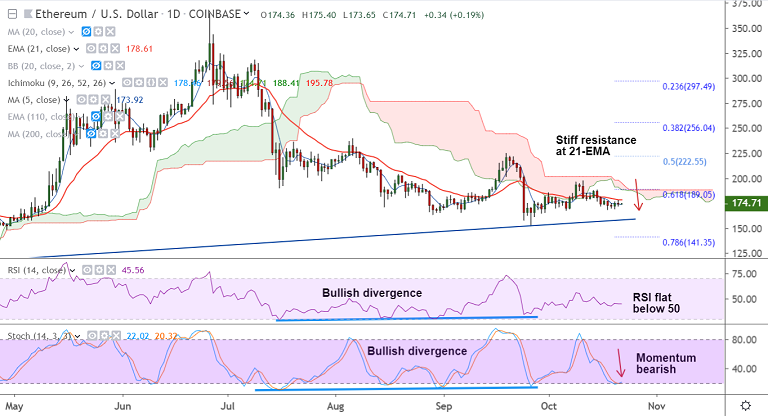
ETH/USD chart - Trading View
Exchange - Coinbase
Support: 158.50 (trendline); Resistance: 178.62 (21-EMA)
Technical Analysis: Bias Bearish
ETH/USD capped below 21-EMA resistance, 'Spinning Top' formed on the previous day's candle dents any upside hopes.
The pair was trading rangebound at 174.94 at 06:10 GMT after closing 0.64% lower in the previous session.
Major and minor trend in the pair are bearish. Both long and short term moving averages are biased lower in the GMMA indicator.
Recovery attempts lack traction, 'Spinning Top' at 21-EMA resistance shows lack in traders' conviction.
Volatility is low. Resumption of weakness will see test if trendline support at 158.50 levels.
Violation at trendline will see major weakness. Break above 21-EMA will buoy bulls in Ethereum.
Immediate resistance above 21-EMA lies at 185.48 (55-EMA) ahead of 190.67 (Upper BB).


Comment 0