TRX/USD chart - Trading View
Exchange - Bitfinex
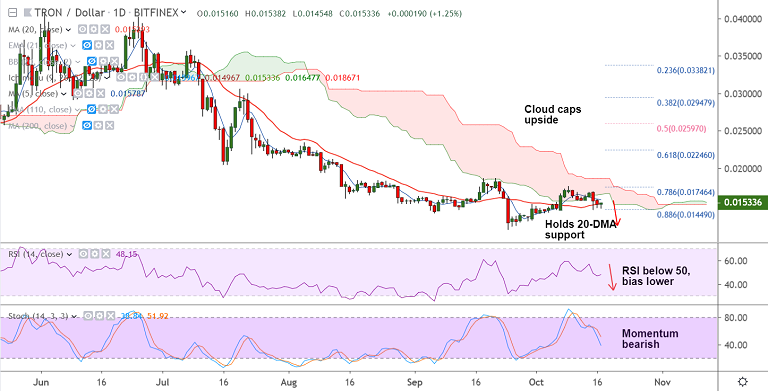
Support: 0.014490 (88.6% Fib); Resistance: 0.016547 (55-EMA)
Technical Analysis: Bias bearish
TRON (TRX) has been extending gradual grind lower after upside was capped at 55-EMA.
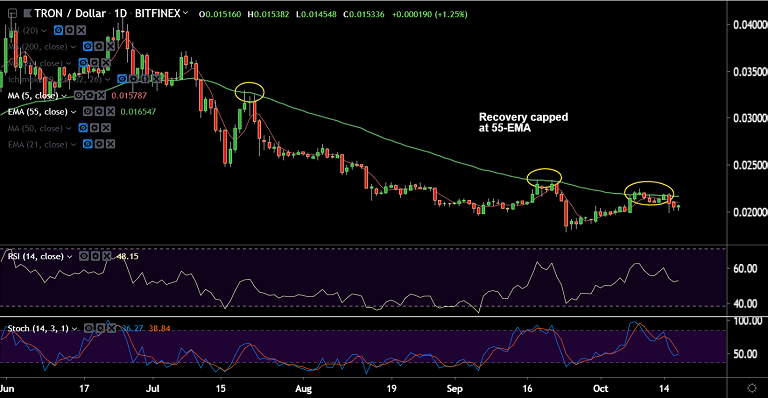
Technical indicators on the daily charts are biased lower. RSI below 50 and stochs are sharply lower.
5-DMA has turned indicating near-term downside. TRX/USD is holding support at 20-DMA (0.015291).
Break below 20-DMA will see resumption of downside. Test of fresh multi-month lows likely.
Failure to break below 20-DMA could see further consolidation. Breakout above cloud will invalidate near-term bearish bias.









Comment 0