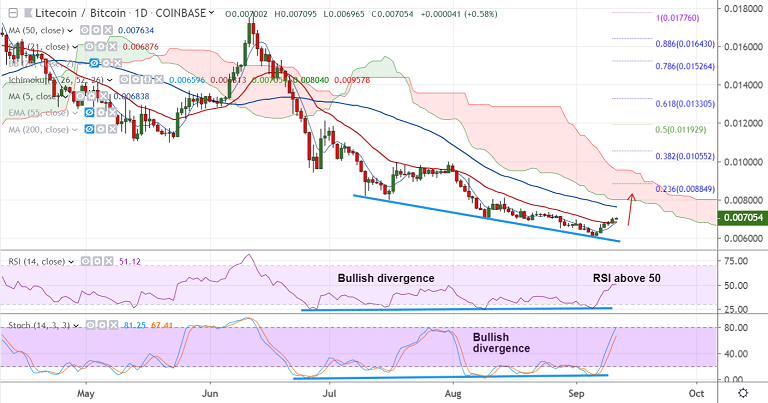
LTC/BTC chart - Trading View
Exchange - Coinbase
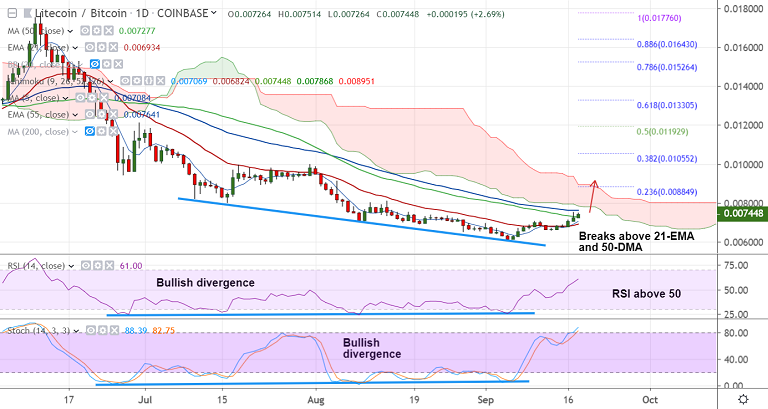
Support: 0.006934 (21-EMA); Resistance: 0.007641 (55-EMA)
Technical Analysis: Bias Bullish
LTC/BTC was trading over 3% higher on day at 0.007471 at 08:00 GMT.
The pair has shown a break above 21-EMA and technical indicators support upside.
Stochs and RSI are sharply higher and 'bullish divergence' on RSI and Stochs adds to the bullish bias.
Price action has also broken above 50-DMA and is on track to test 55-EMA at 0.007641.
Volatility is rising as indicated by widening Bollinger bands. Break above 55-EMA finds little resistance till 23.6% Fib at 0.008849.
On the flipside, 5-DMA is immediate support at 0.007087. Retrace below 21-EMA will negate near-term bullish bias.







Comment 0