BTC/USD chart - Trading View
Exchange - Coinbase
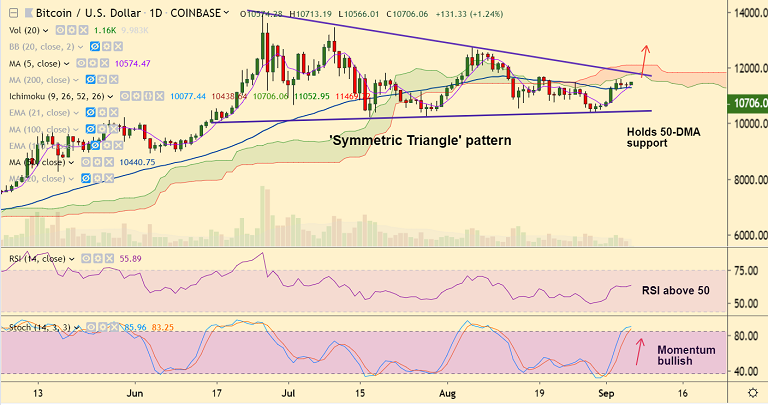
Support: 10440 (50-DMA); Resistance: 11,050 (converged trendline and cloud base)
Technical Analysis: Bias Slightly Bullish
BTC/USD trades 1.35% higher on the day at 10712 at 03:15 GMT, bias is turning slightly bullish.
The pair is trading in a 'Symmetric Triangle' pattern and has been extending range trade from the past three sessions.
Price action is holding above 50-DMA which is strong support at 10,440. We see weakness only on break below.
Technical indicators are turning bullish on the intraday charts. RSI is above 50 and Stochs are biased higher.
Bulls target next major resistance at 11,050 (nearly converged trendline and cloud base). Break above could propel the pair higher.
On the flipside, break below 50-DMA support will see weakness till 38.2% Fib at 9765.


Comment 0