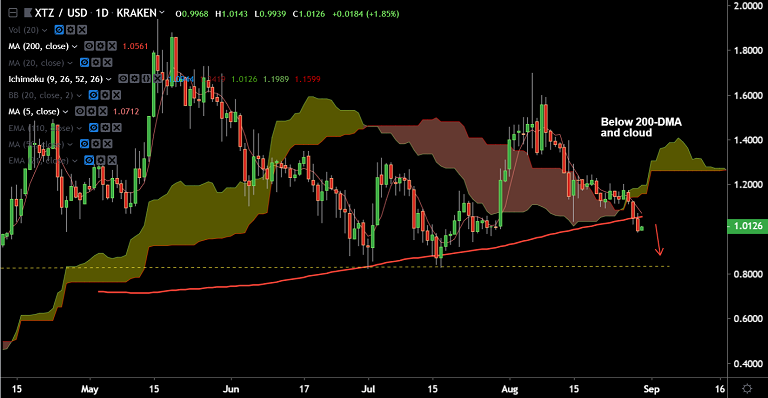
XTZ/USD chart - Trading View
Exchange - Kraken
Support: 0.9276 (88.6% Fib); Resistance: 1.0561 (200-DMA)
Technical Analysis: Bias Bearish
XTZ/USD has slipped below daily cloud and break below 200-DMA opens up downside.
GMMA indicator however does not support a clear downtrend. Longer-term MAs are grinding sideways.
Further, stochs have approached oversold levels raising scope for some pullback.
That said, recovery attempts lack traction. 200-DMA now offers strong resistance.
Only decisive break above 200-DMA (1.0561) could see some upside continuation.
The pair is trading marginally higher on the day at 1.0169 at 10:30 GMT. Resumption of weakness will see test of 88.6% Fib at 0.9276.


Comment 0