XLM/USD chart - Trading View
Exchange - Kraken
Support: 0.0665 (Feb 6 low); Resistance: 0.0808 (21-EMA)
Technical Analysis: Bias Bearish
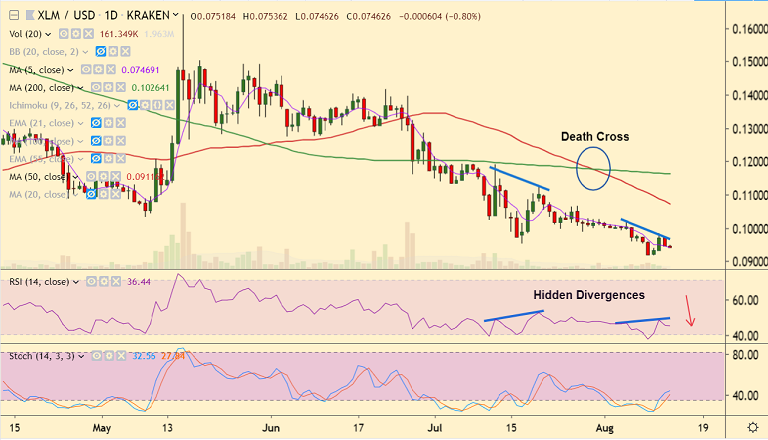
Stellar Lumens set to extend weakness. Hidden 'Bearish Divergence' to support more downside.
XLM/USD trades extremely range-bound on the day with session highs at 0.0753 and lows at 0.0744.
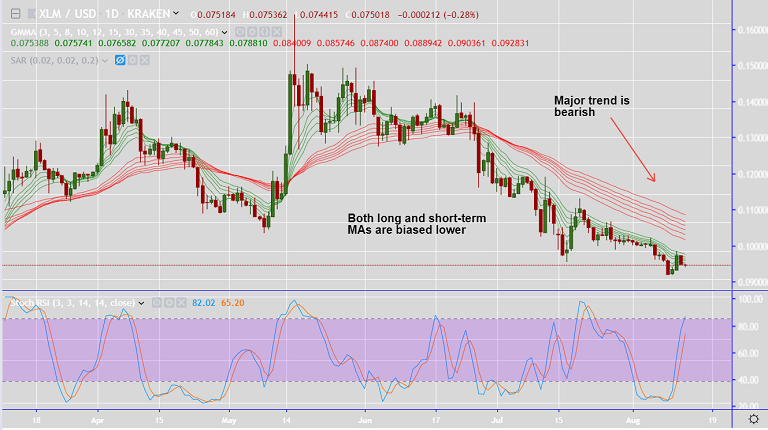
Major trend in the pair is bearish as indicated by GMMA indicator.

Further, formation of 'Death Cross' (bearish 50-DMA crossover on 100-DMA) adds to the downside bias.
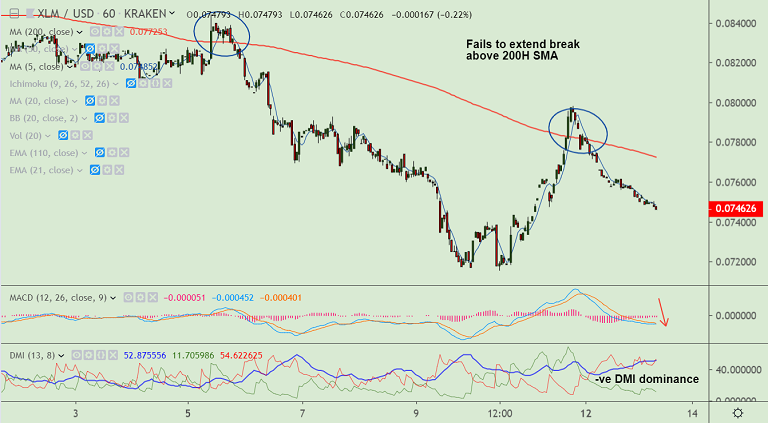
Recovery attempts lack traction. Price has failed to extend break above 200H SMA.

Scope for test of next major support at 0.0665 (Feb 6 low). Break above 21-EMA (0.0808) will see minor upside.


Comment 0