(Refer BTC/USD chart on Trading View)
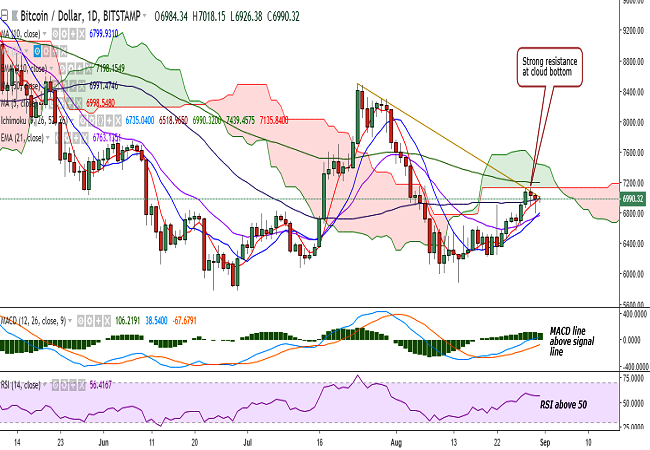
BTC/USD dropped to 6792 levels on Thursday before closing at 6984 levels (Bitstamp).
The pair is currently hovering around 5-DMA at 6980 levels at the time of writing.
On the top side, the pair’s upside is capped by 7006 (trend line joining 8496 and 7125) and a break above would target 7068 (90-EMA)/7135 (cloud bottom)/7197 (110-EMA)/7300/7399 (1w 20-SMA).
On the downside, the pair has found support near 6825 (2h 90-EMA) and any violation would drag it to 6798 (10-DMA)/6700/6649 (38.2% retracement of 5880 and 7125.28)/6576 (20-DMA)/6500.
Bias appears neutral on the daily chart as the pair is trading in a narrow range forming a doji pattern at the time of writing. Yesterday’s hammer pattern suggests bulls are trying hard to maintain the pair’s upward momentum.
The pair faces stiff resistance at the cloud bottom and further bullishness could be confirmed only on a break above.
Recommendation: Wait for clear directional bias.

<Copyright ⓒ TokenPost, unauthorized reproduction and redistribution prohibited>


Comment 0